Meanigfull data design
Hugo Hiemstra 2023
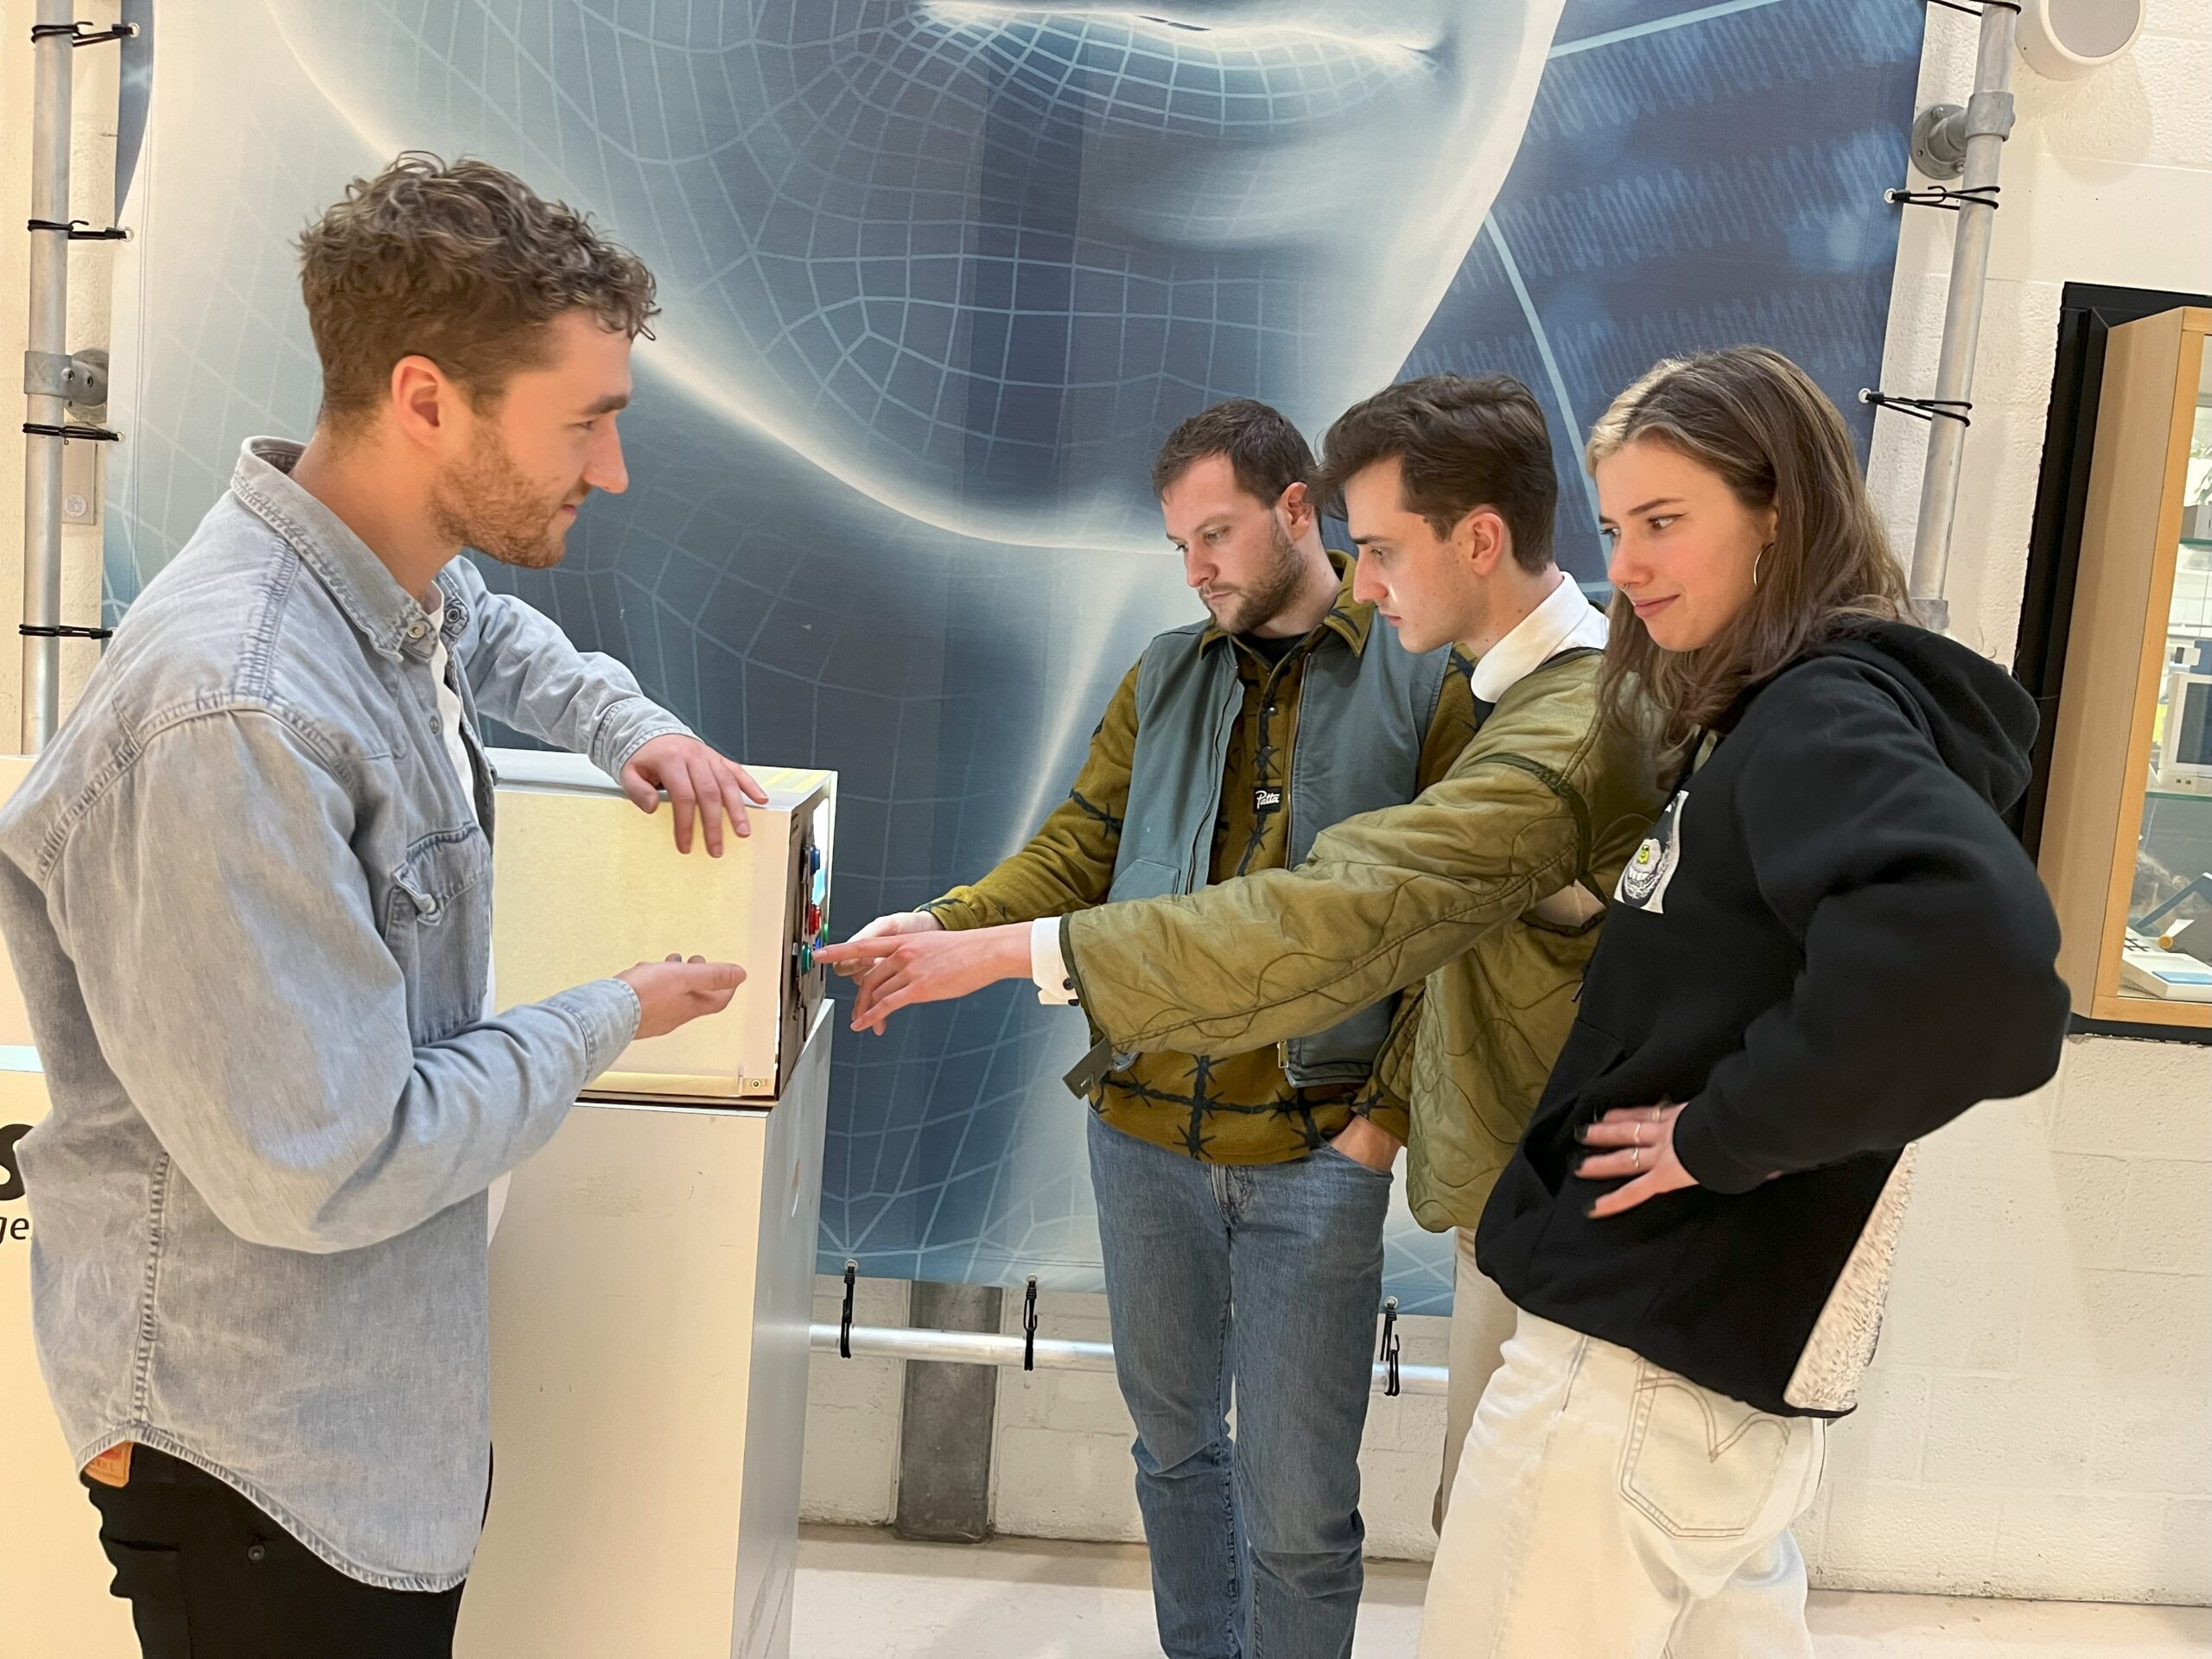
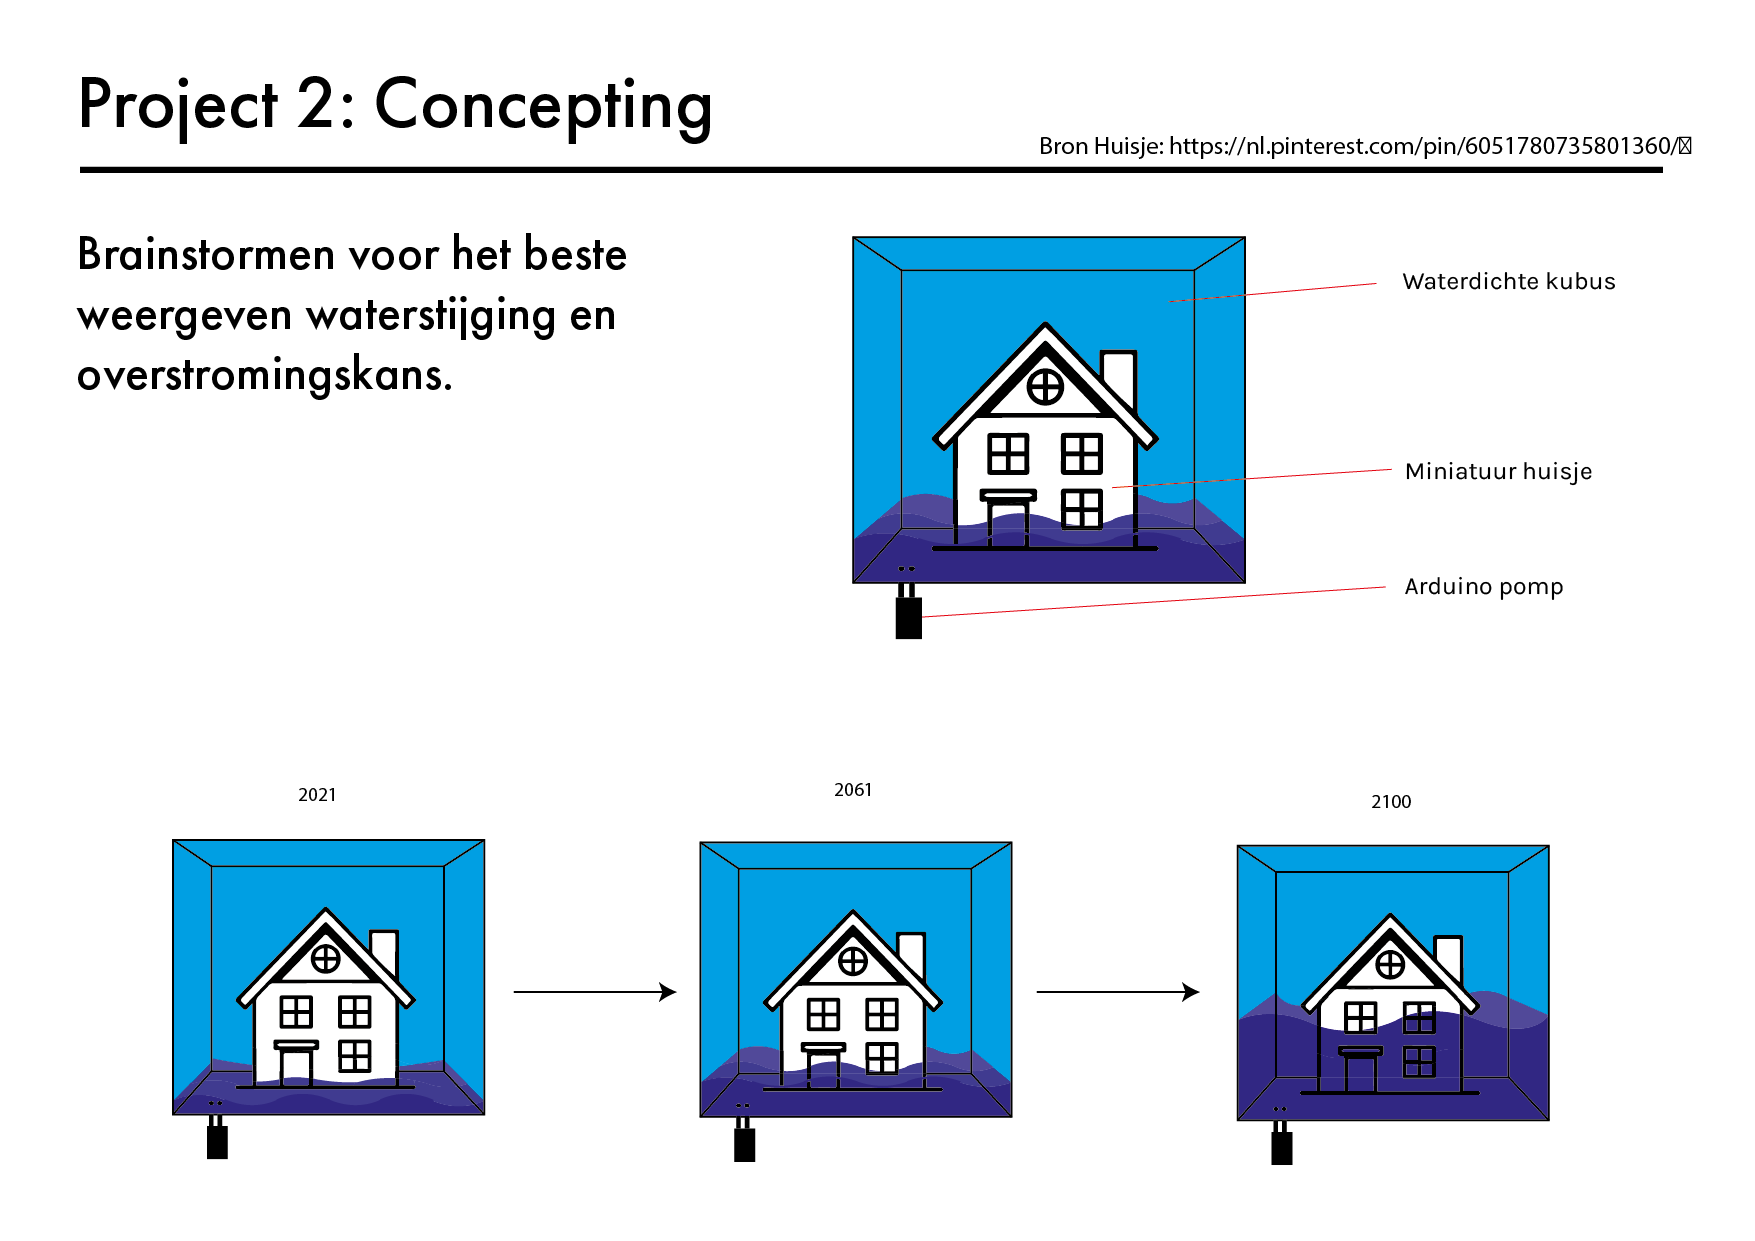
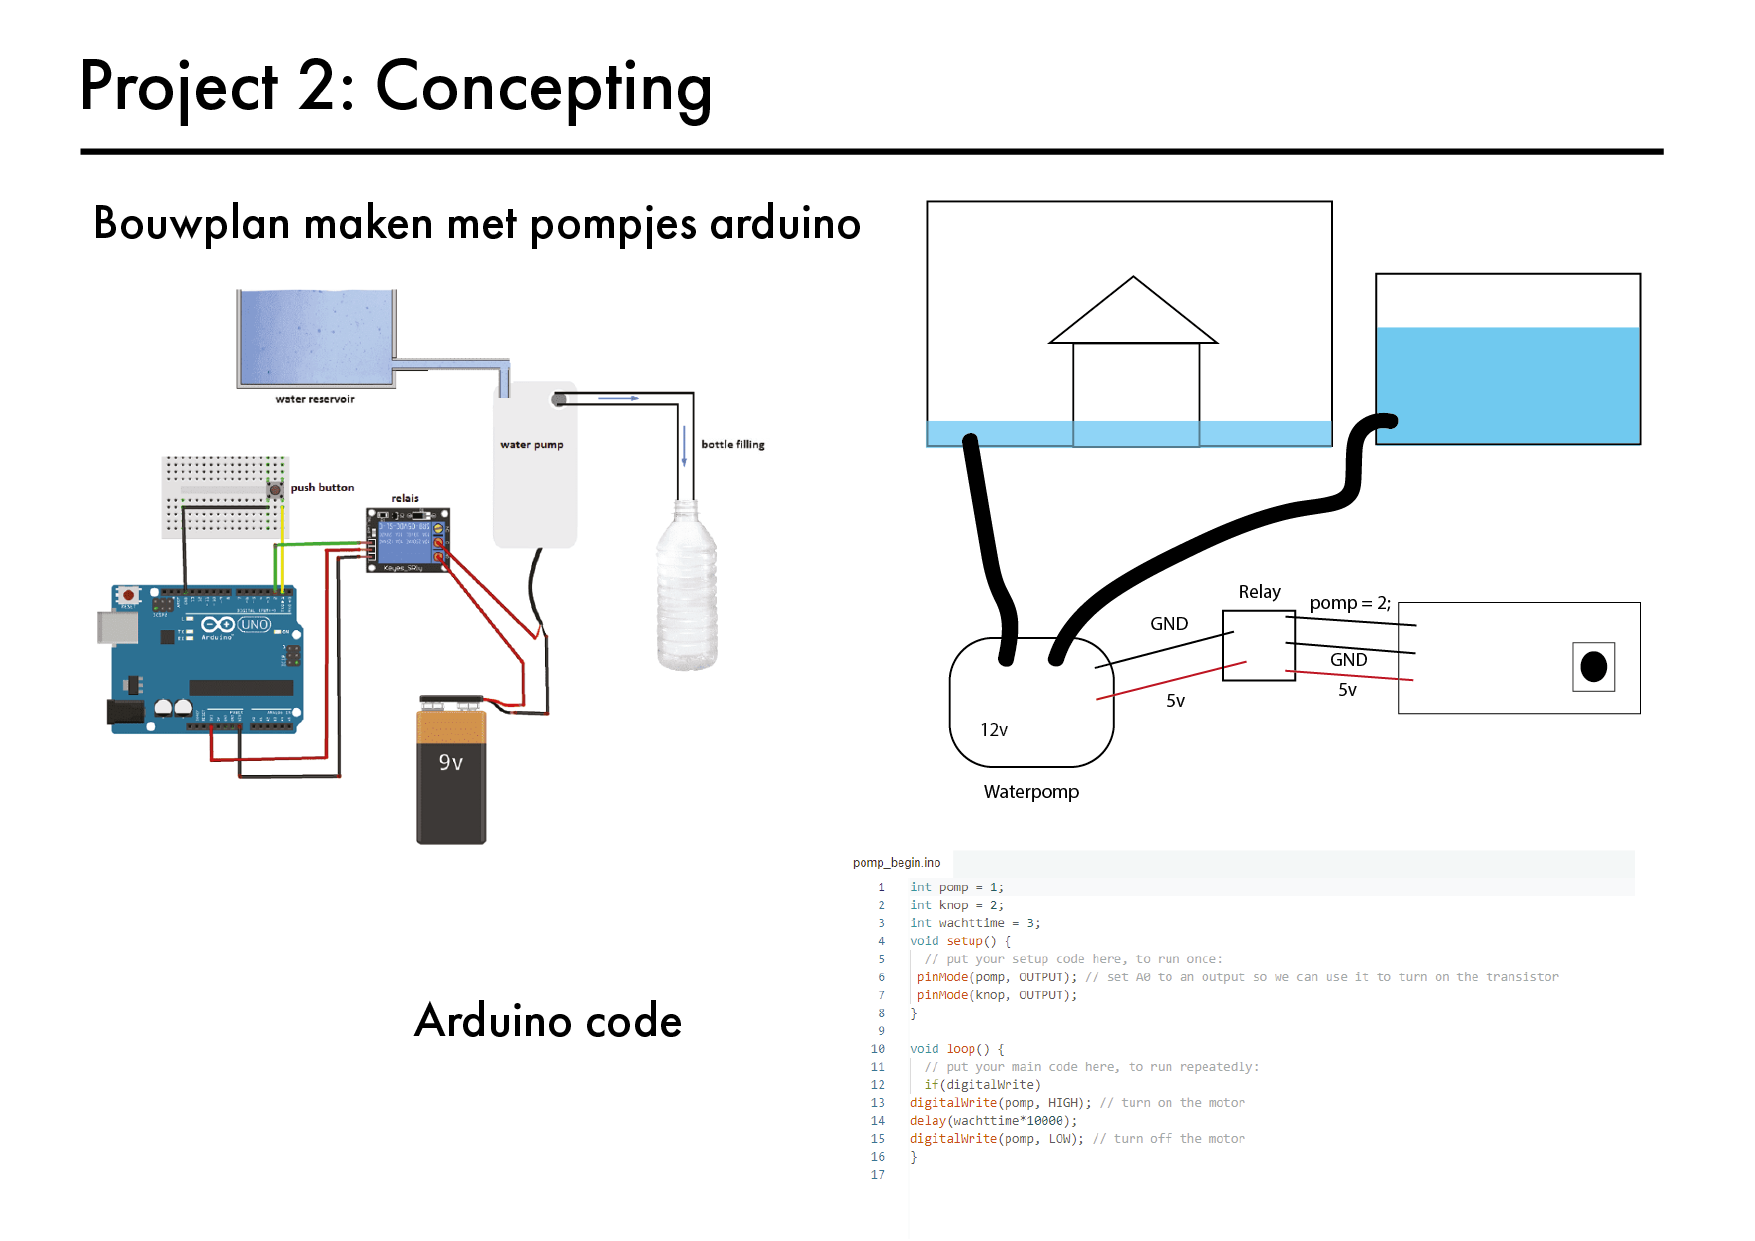
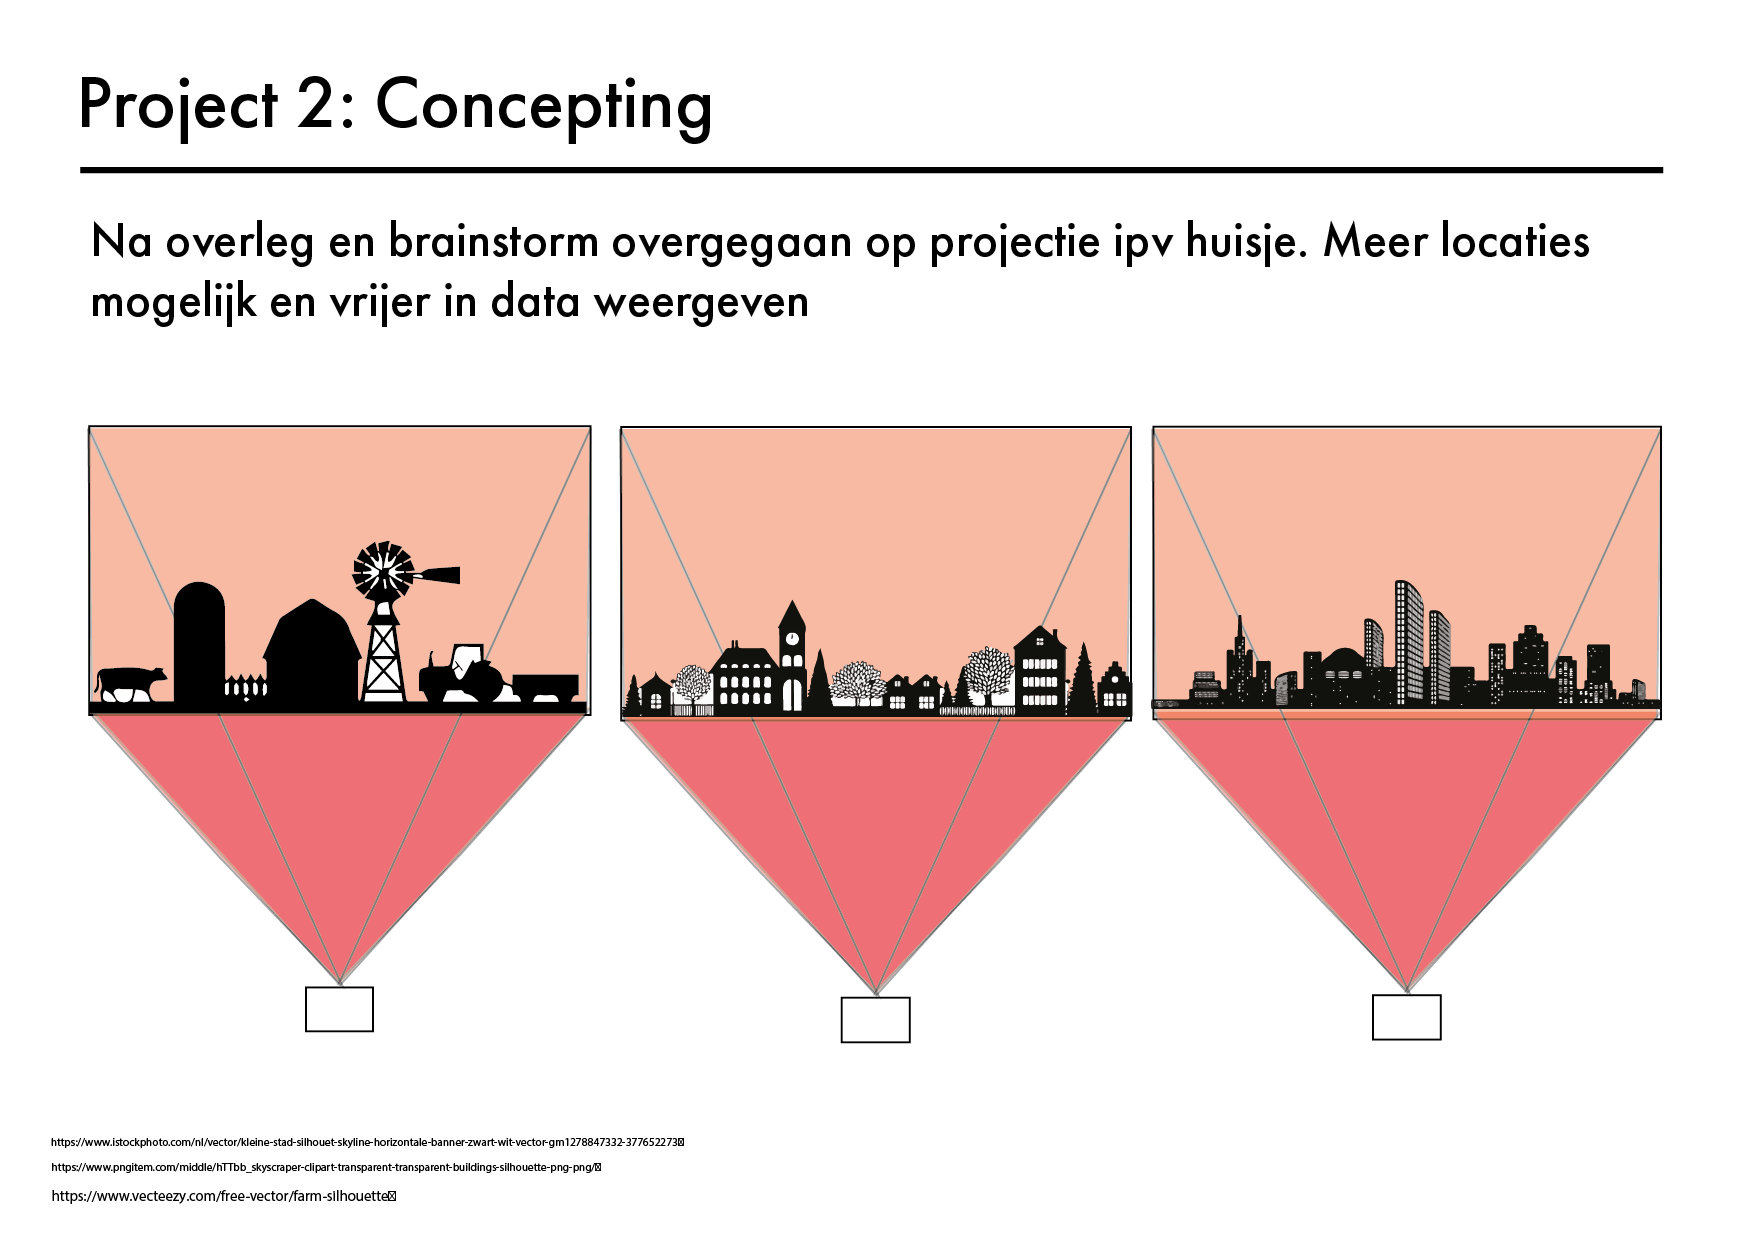
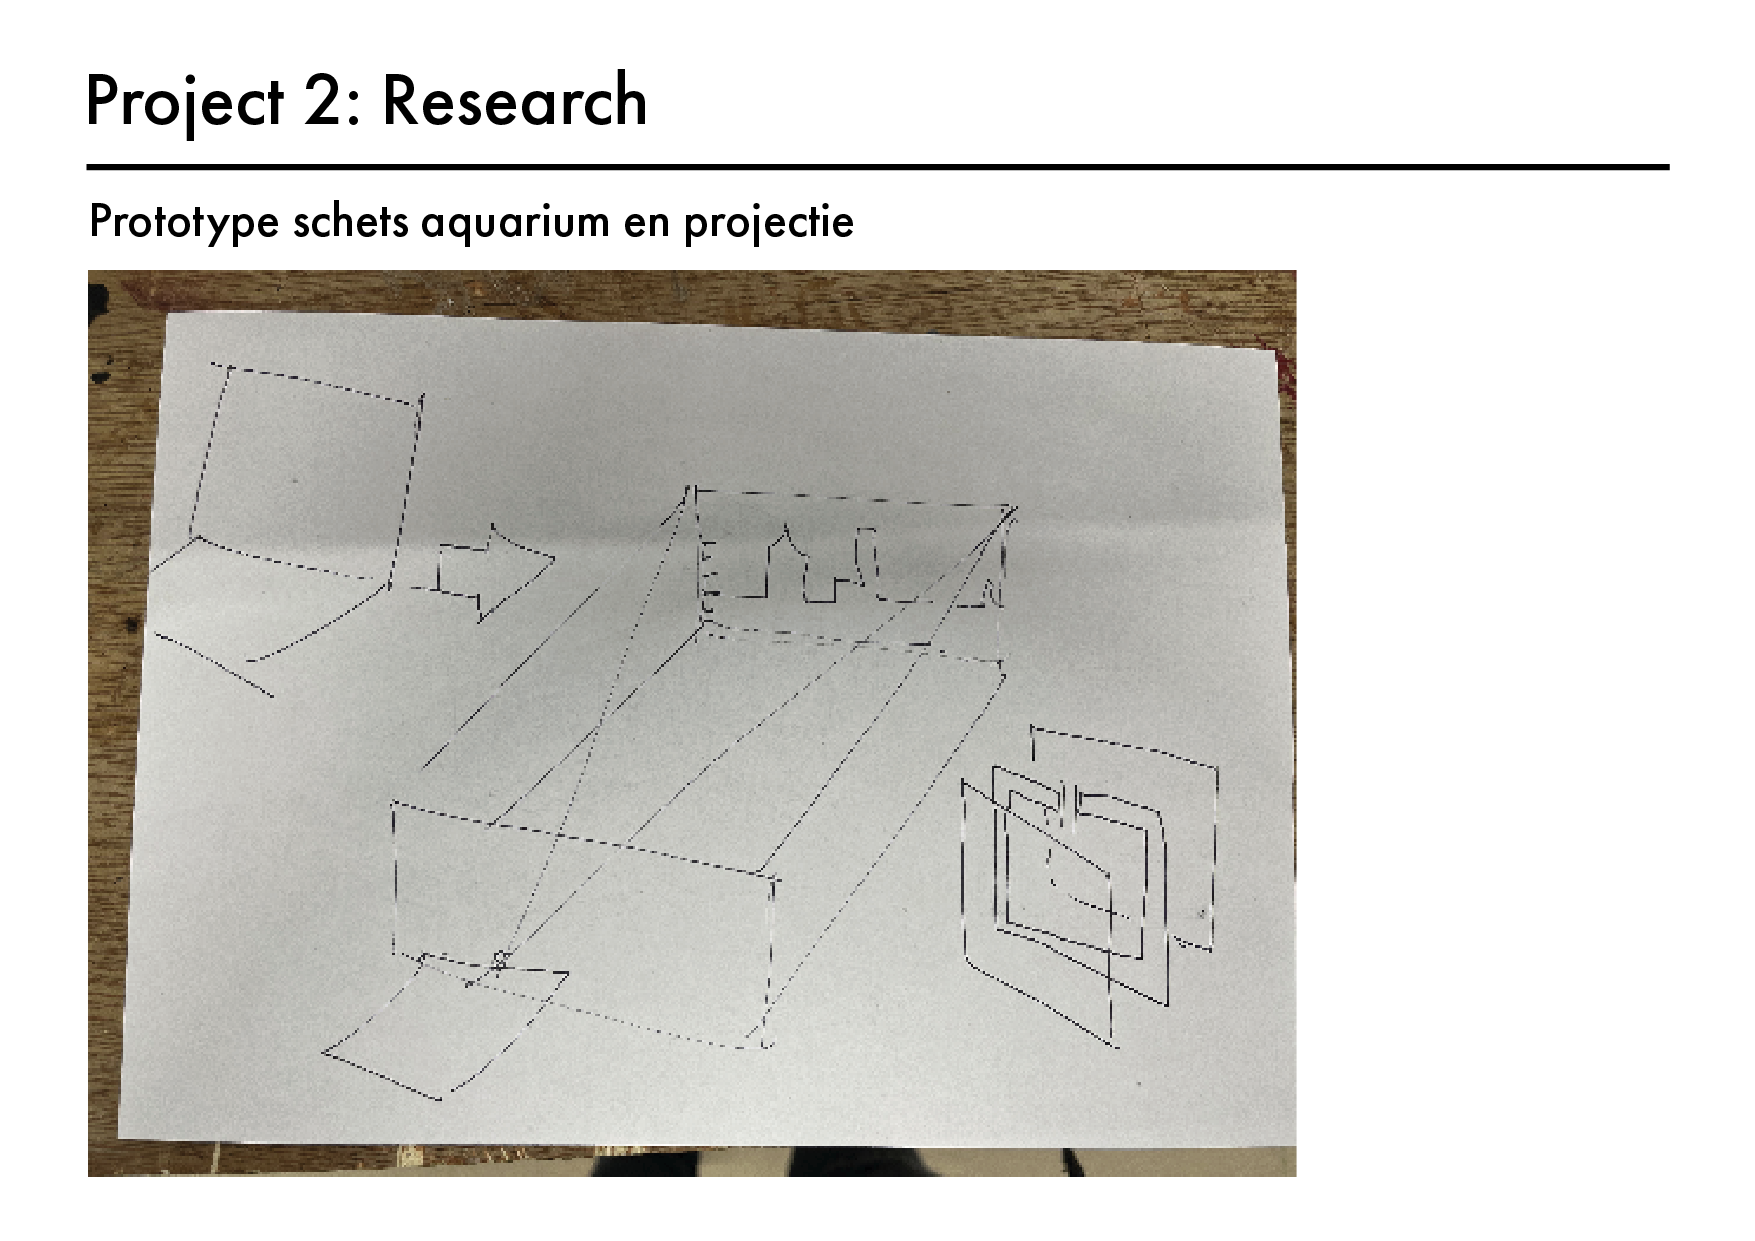
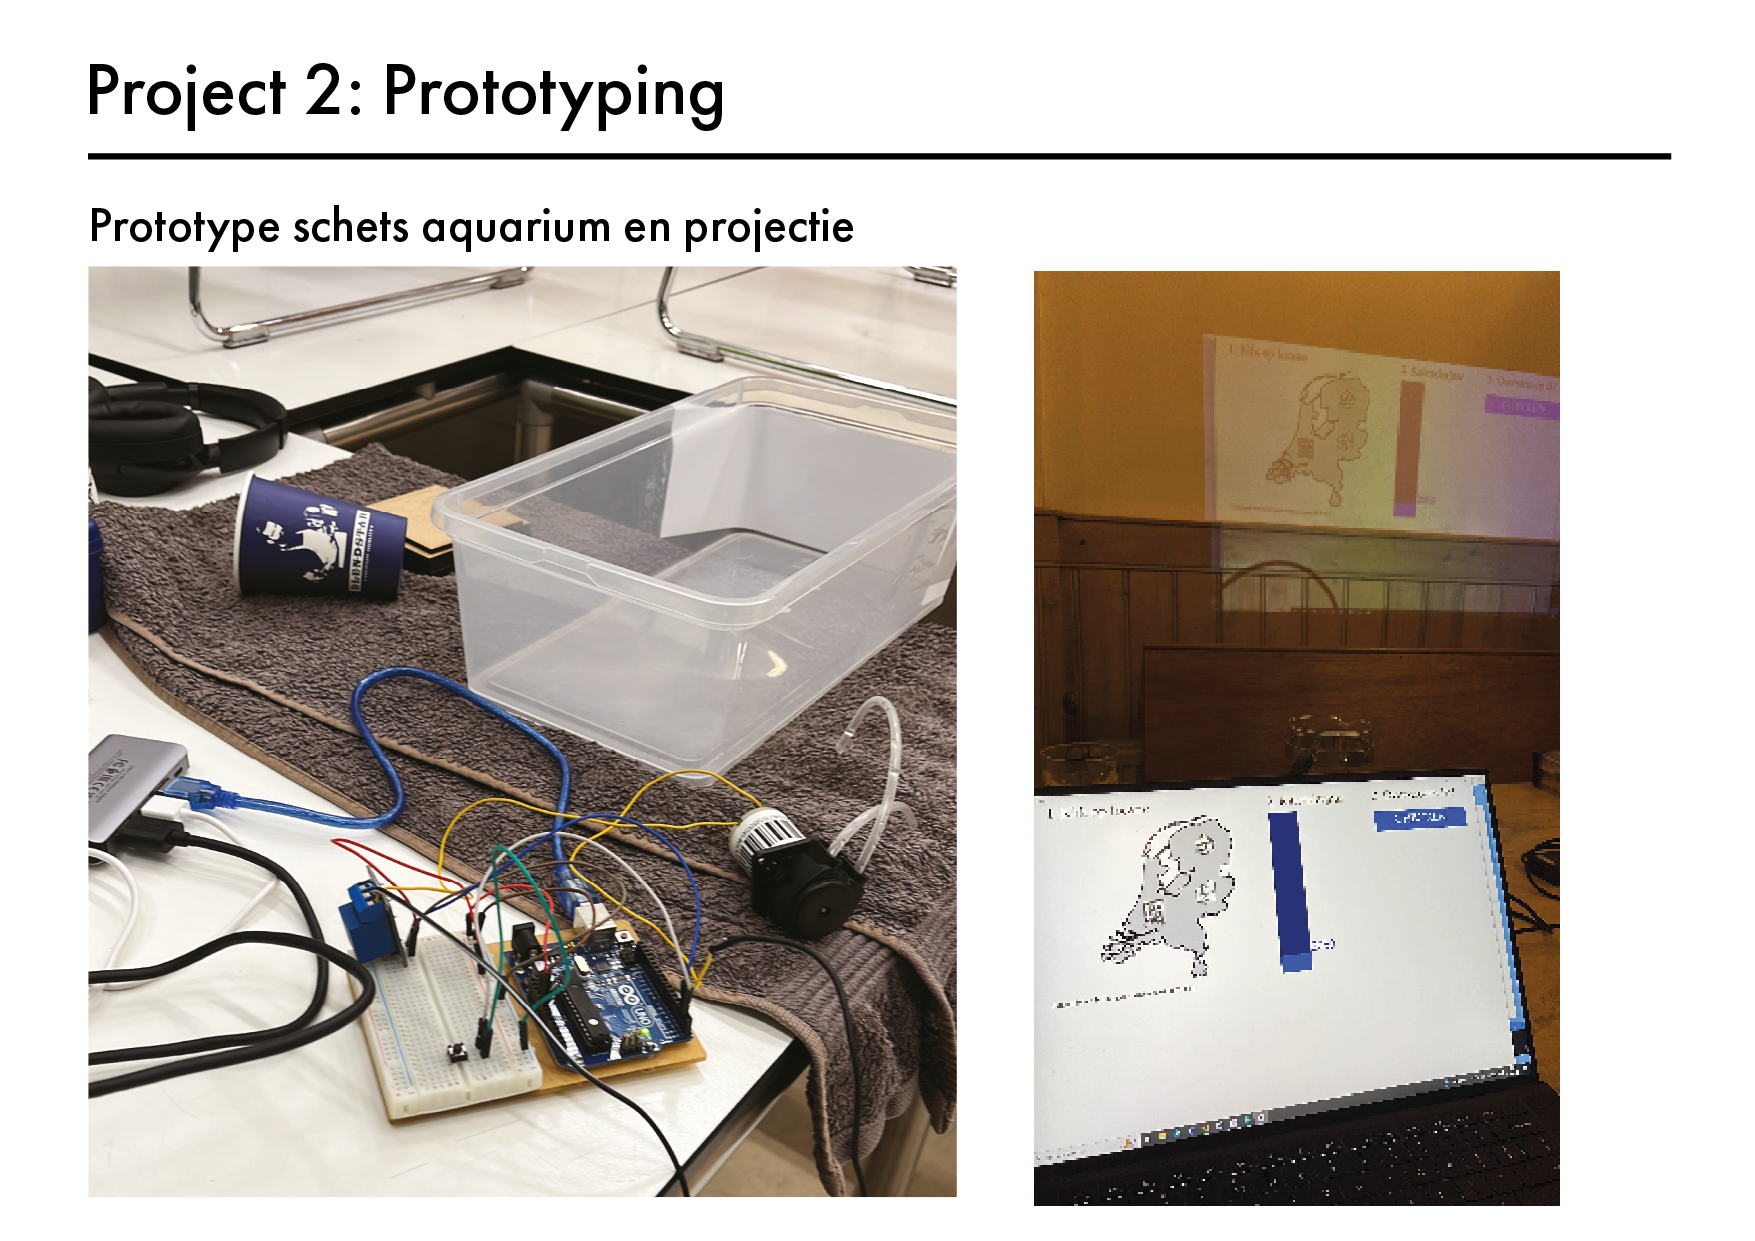
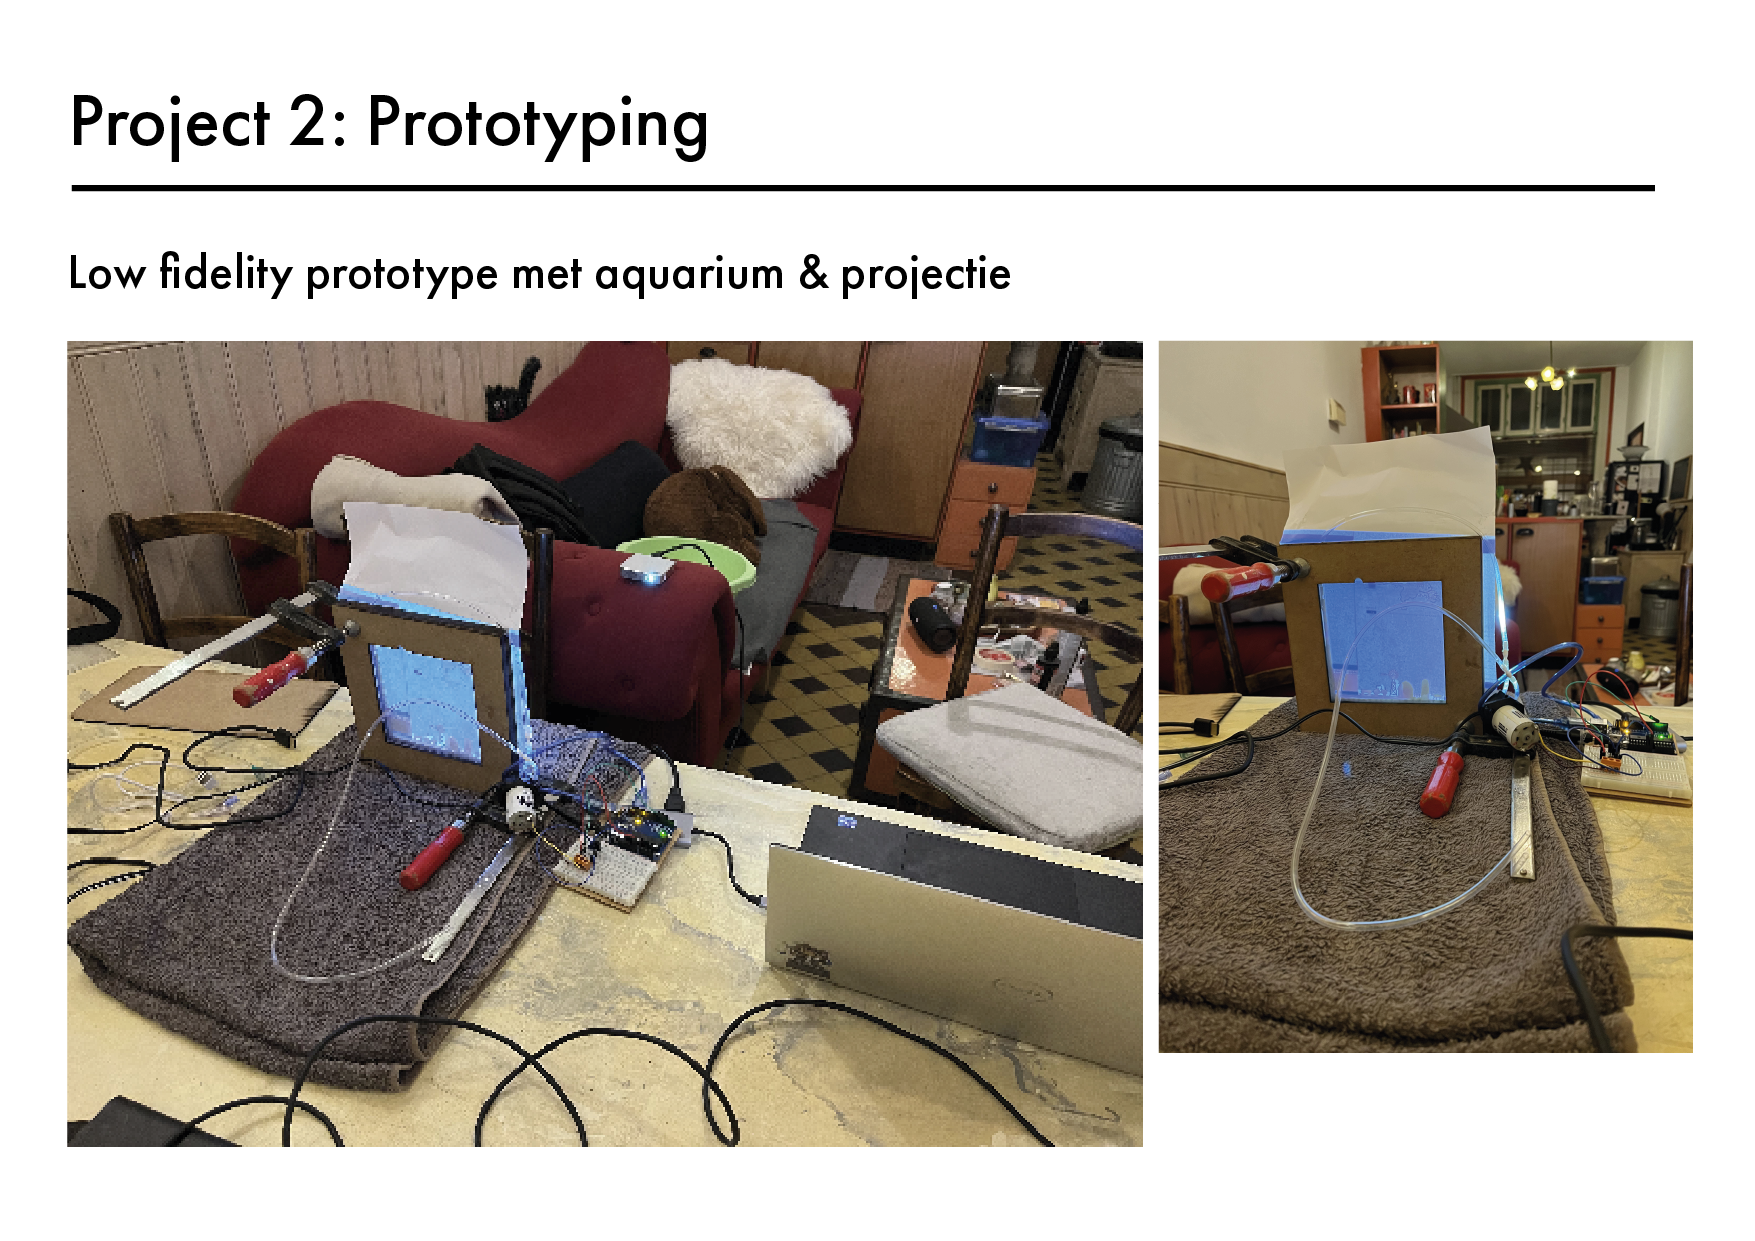
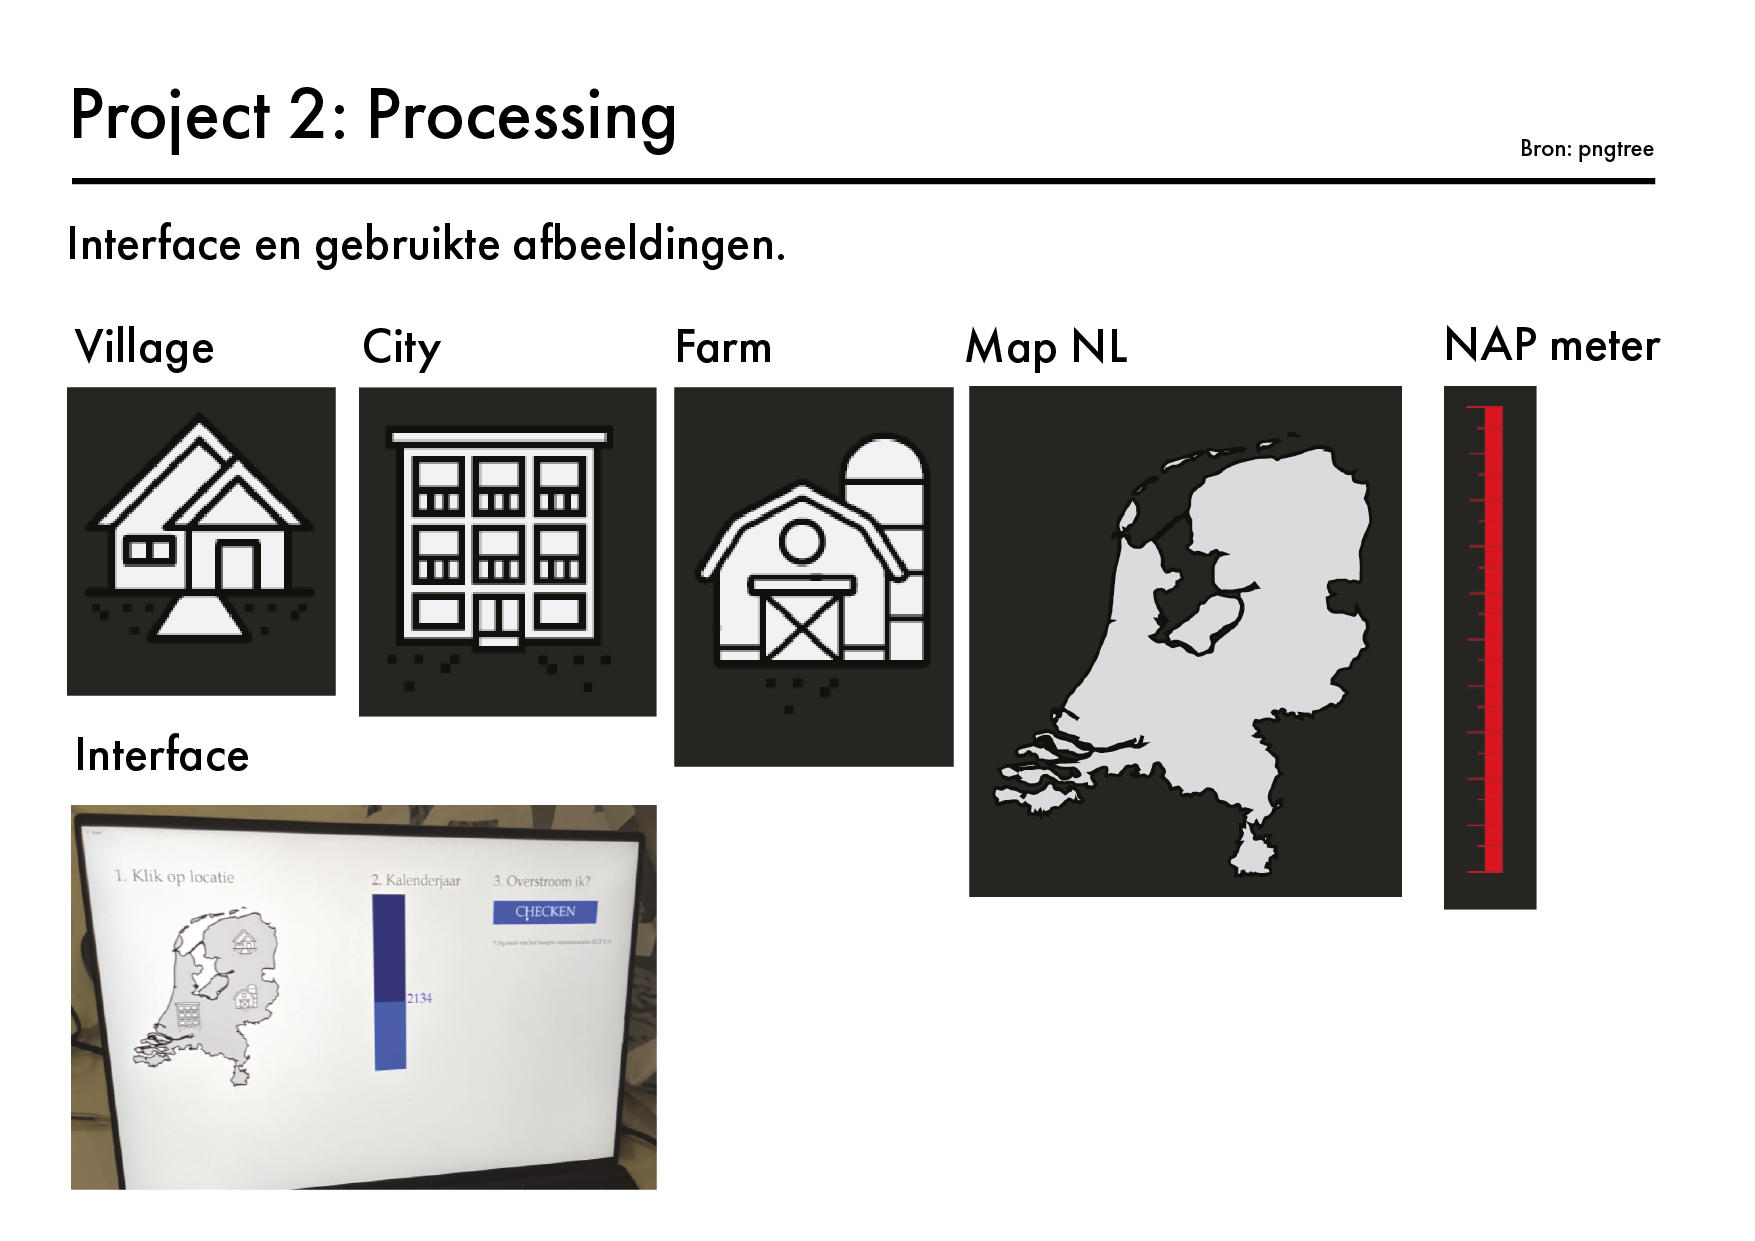
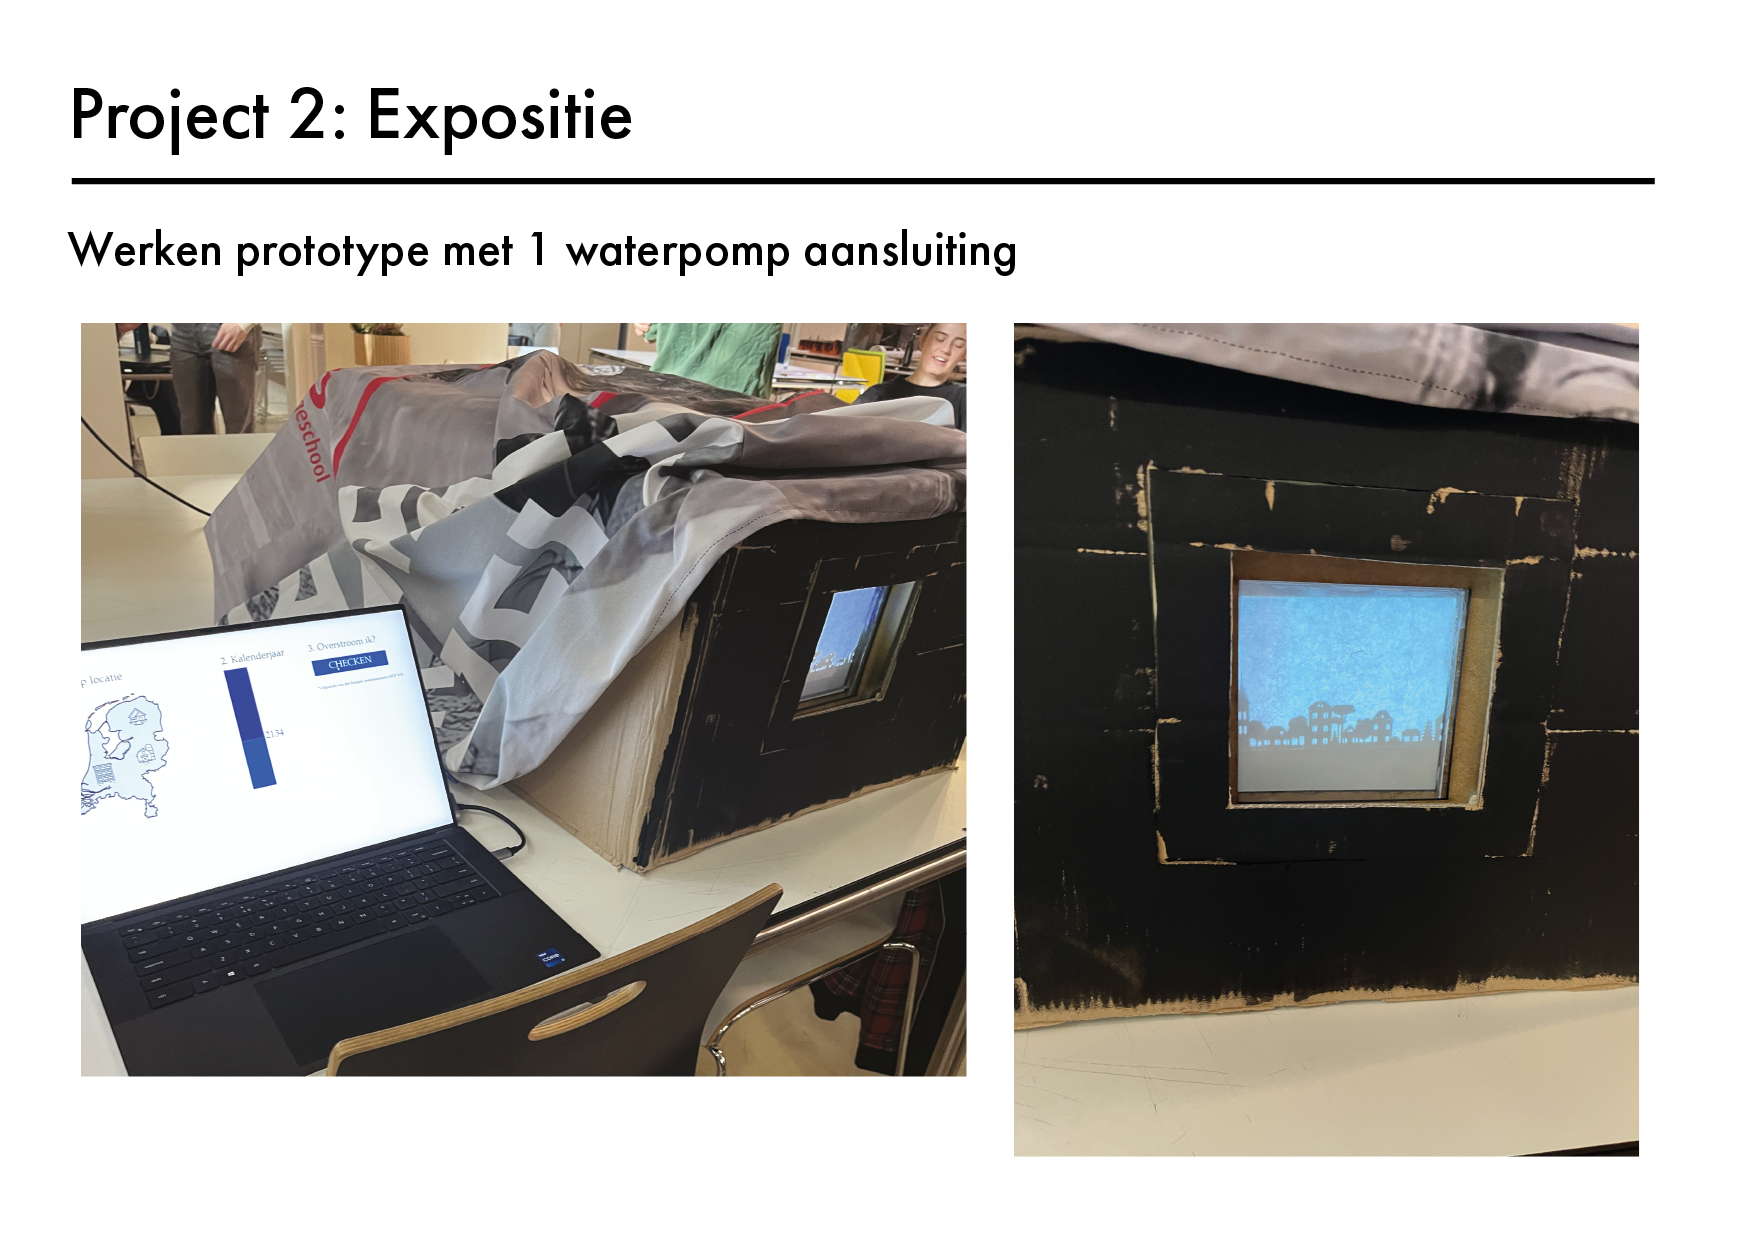
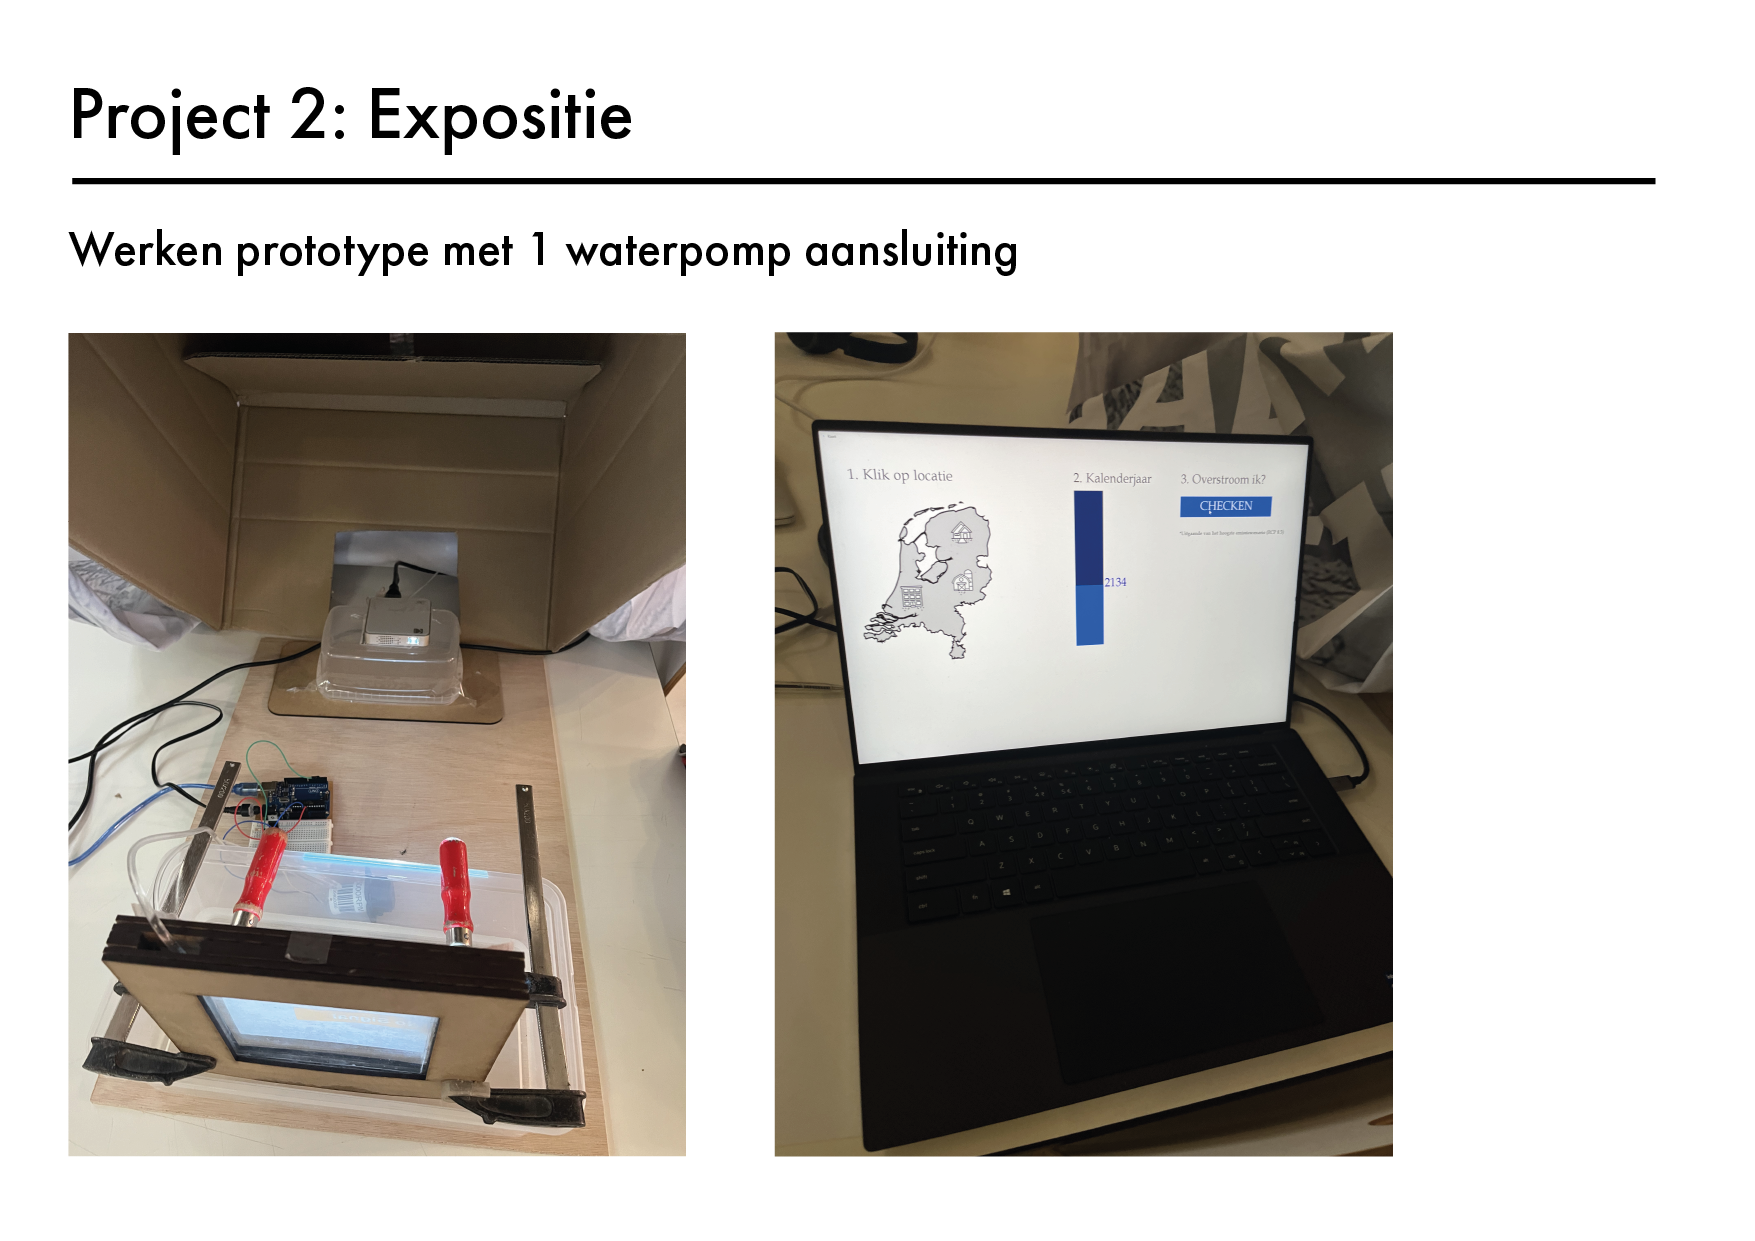
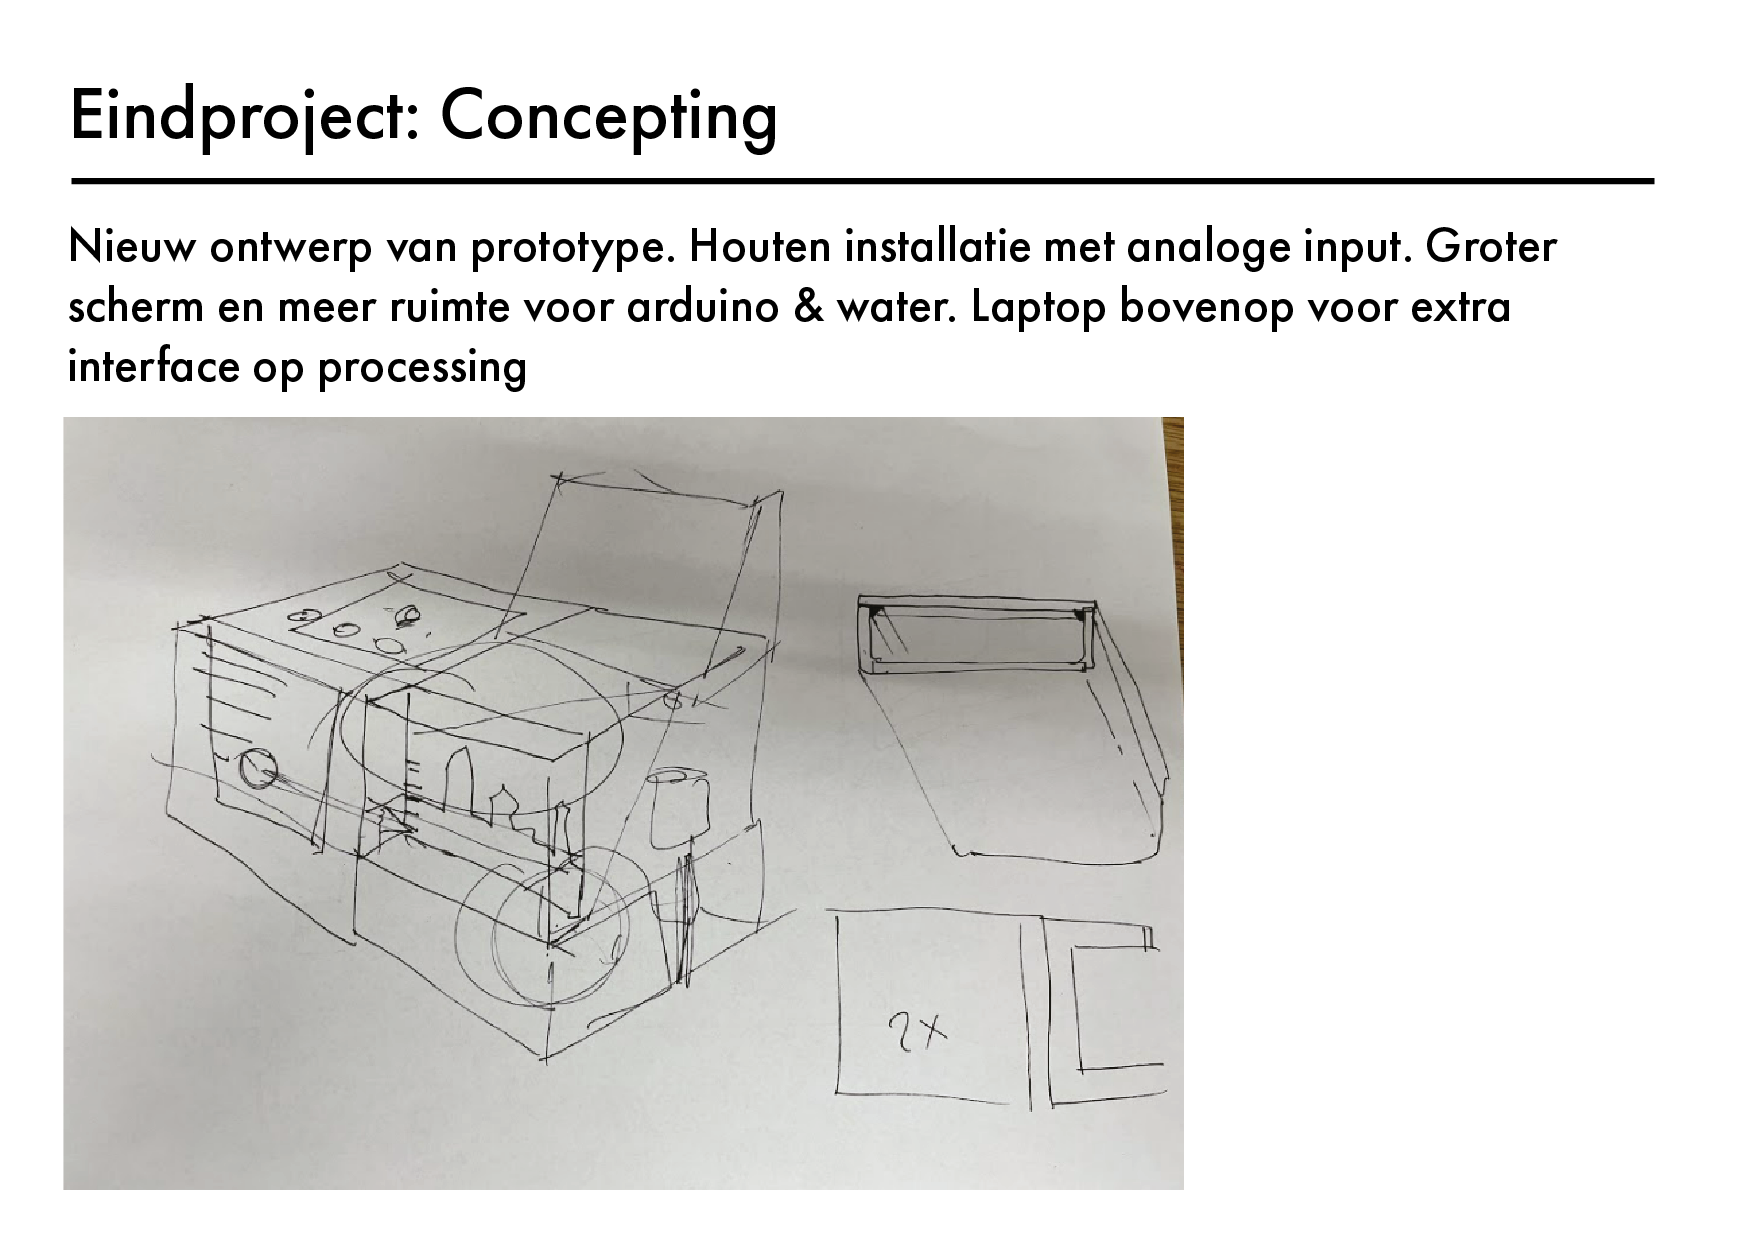
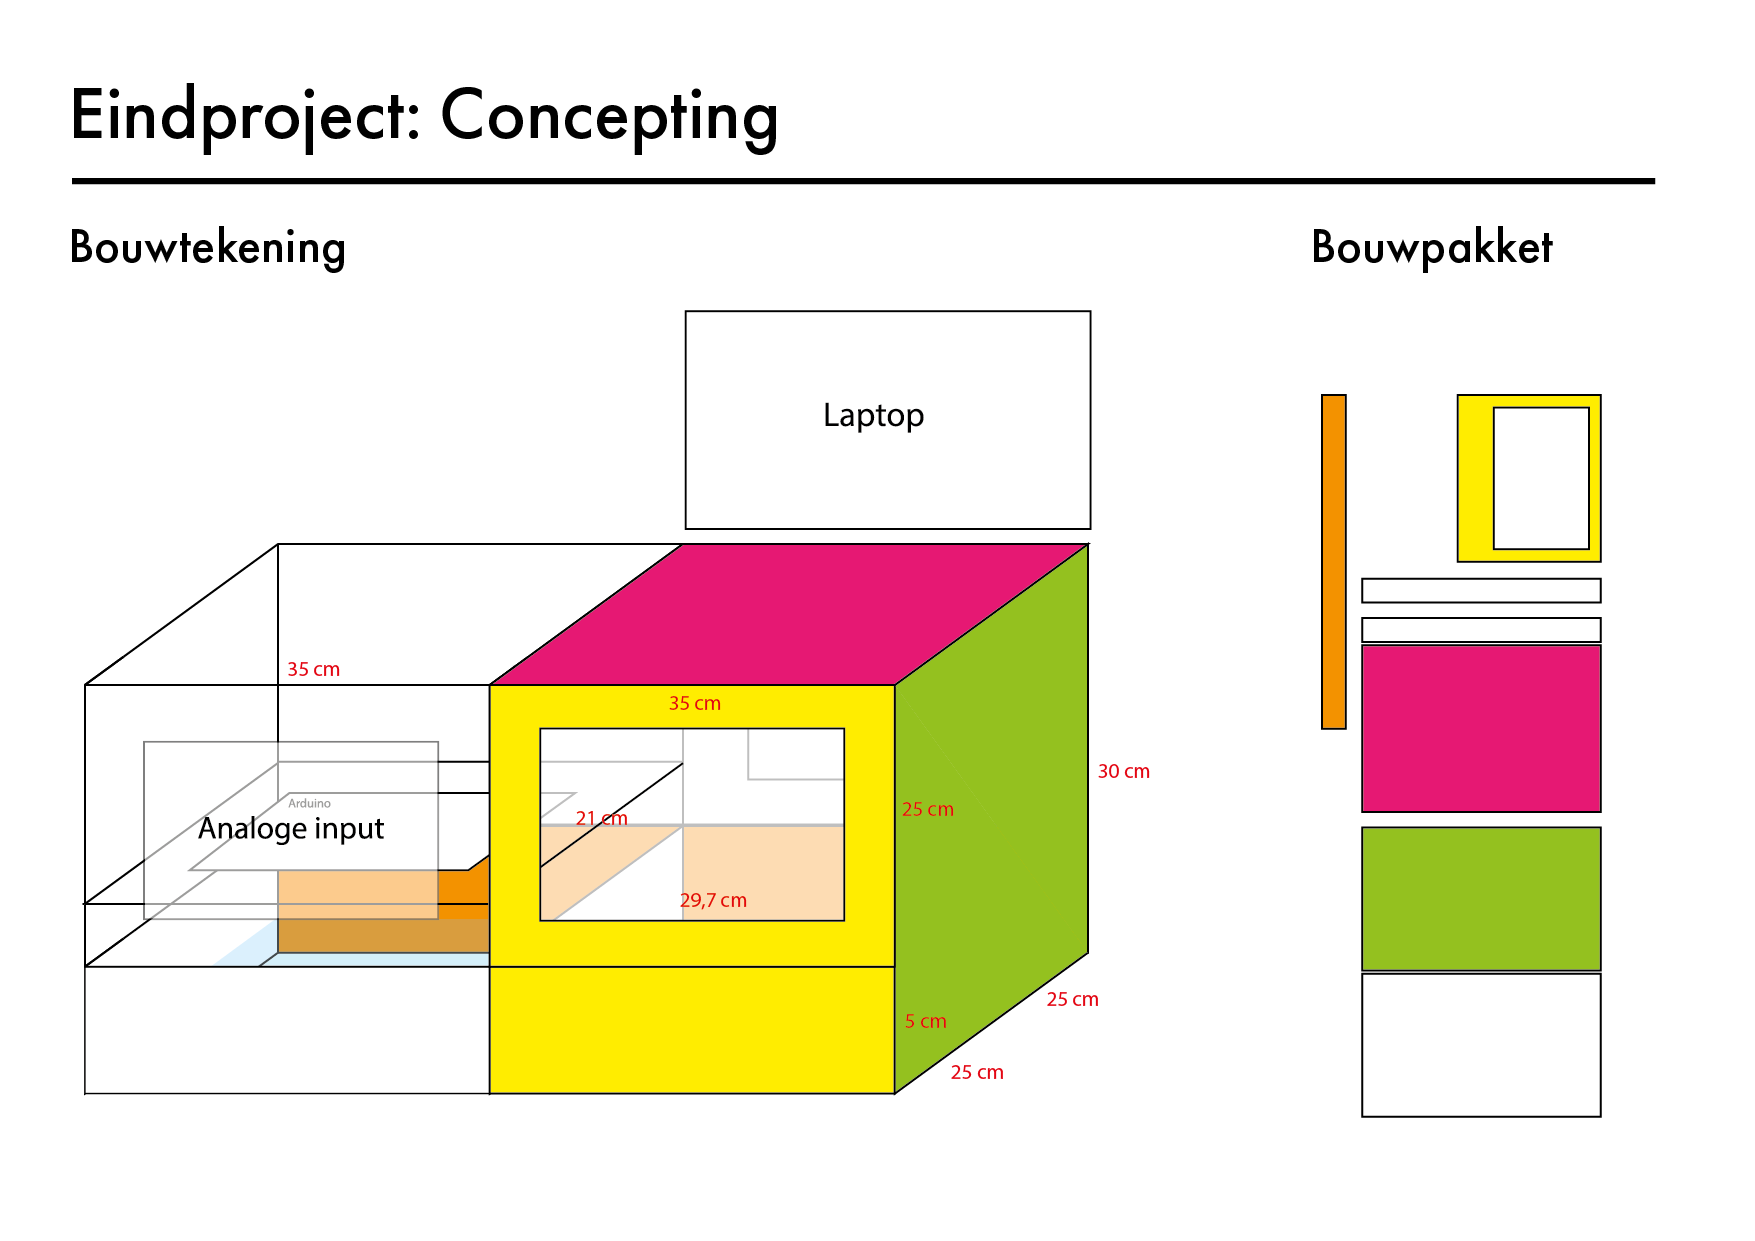
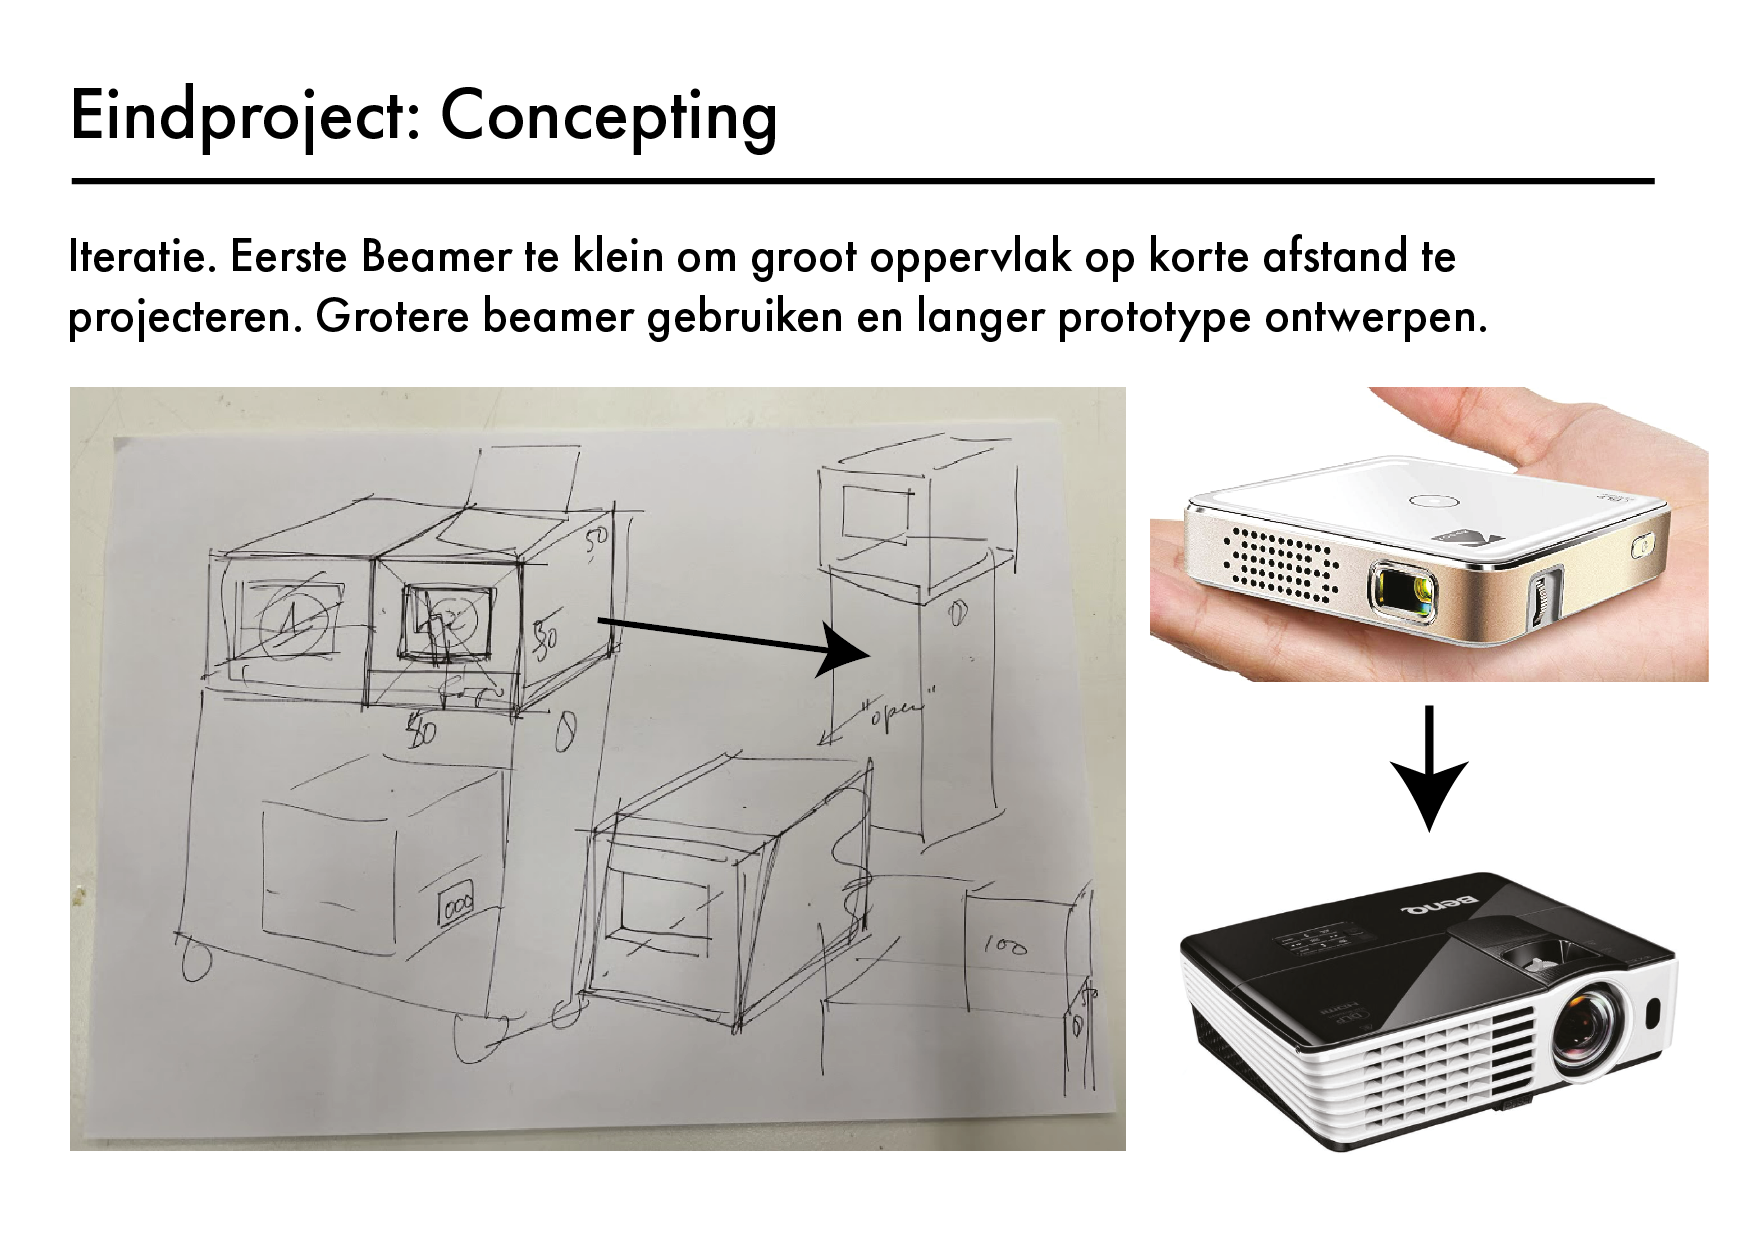
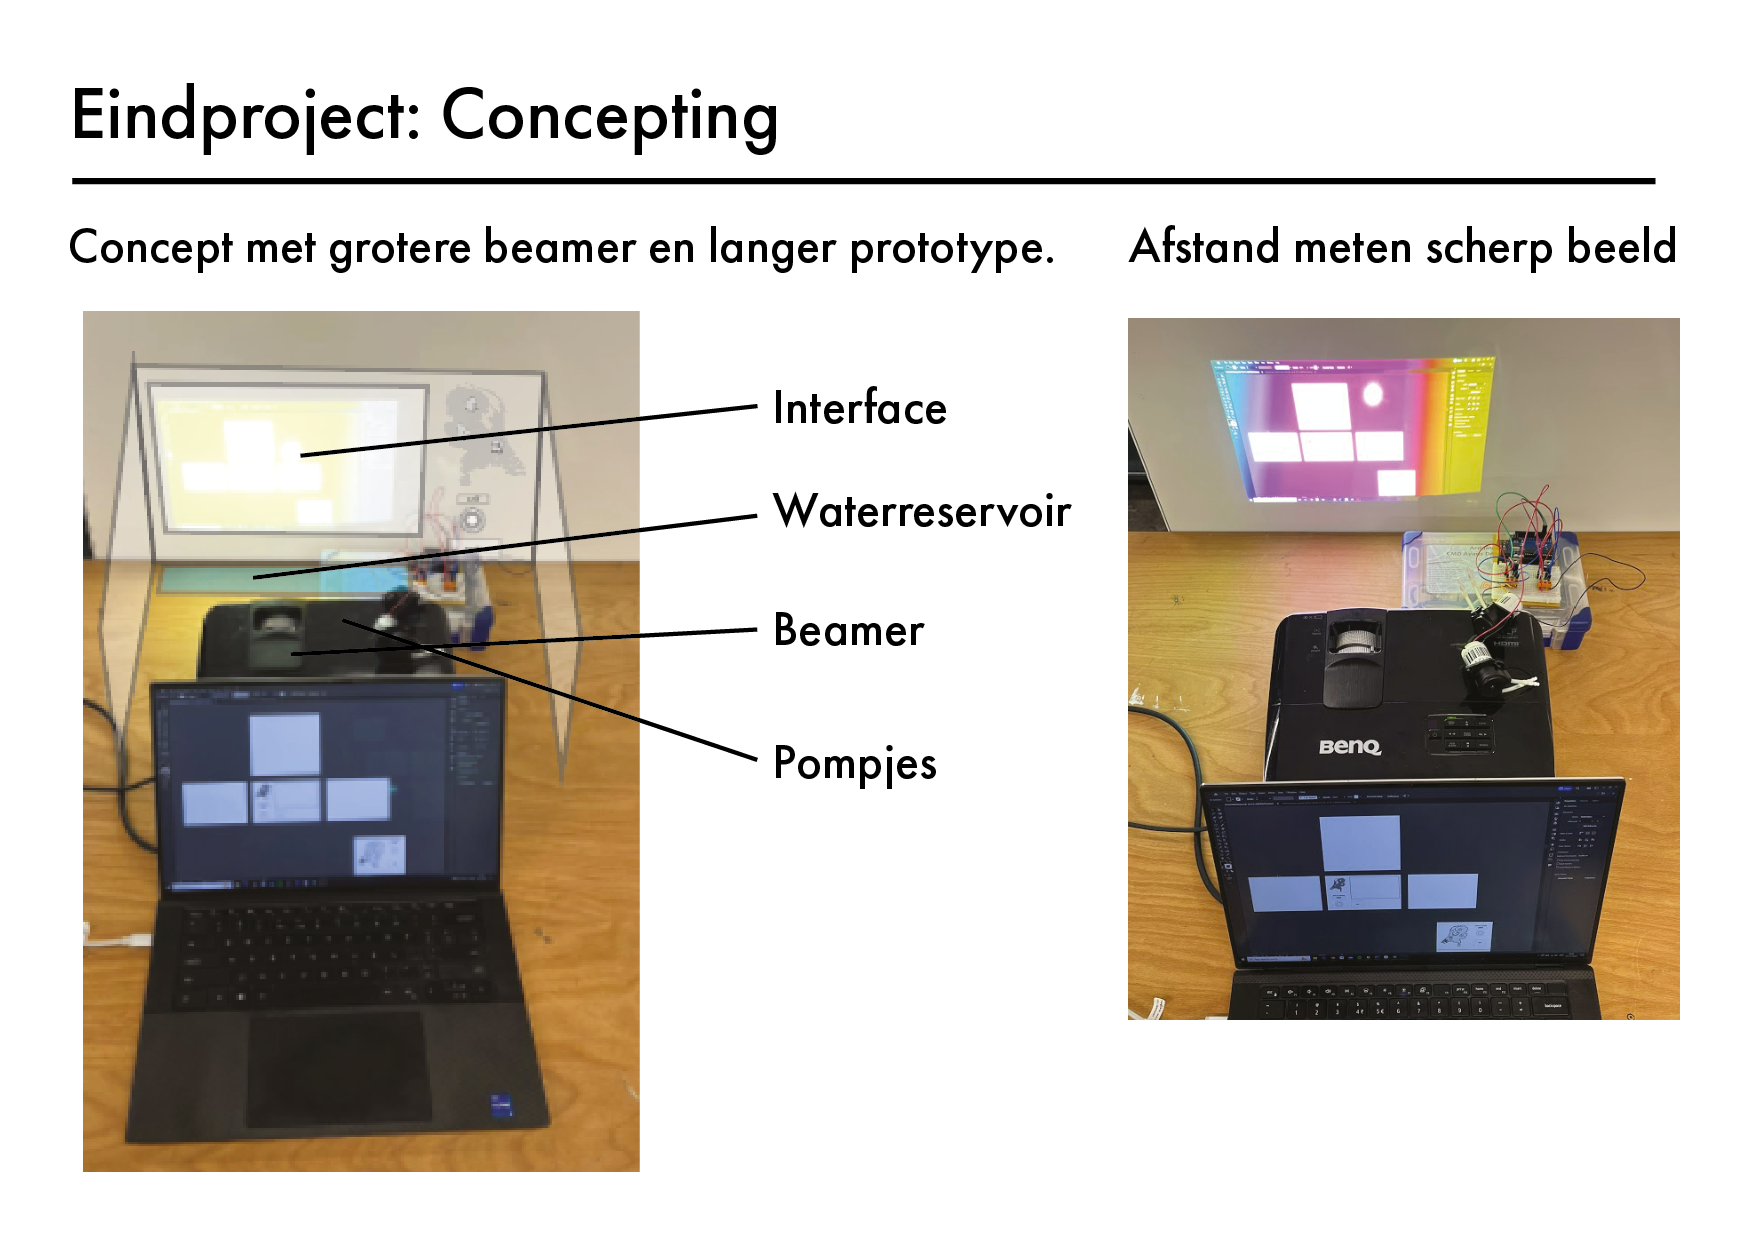
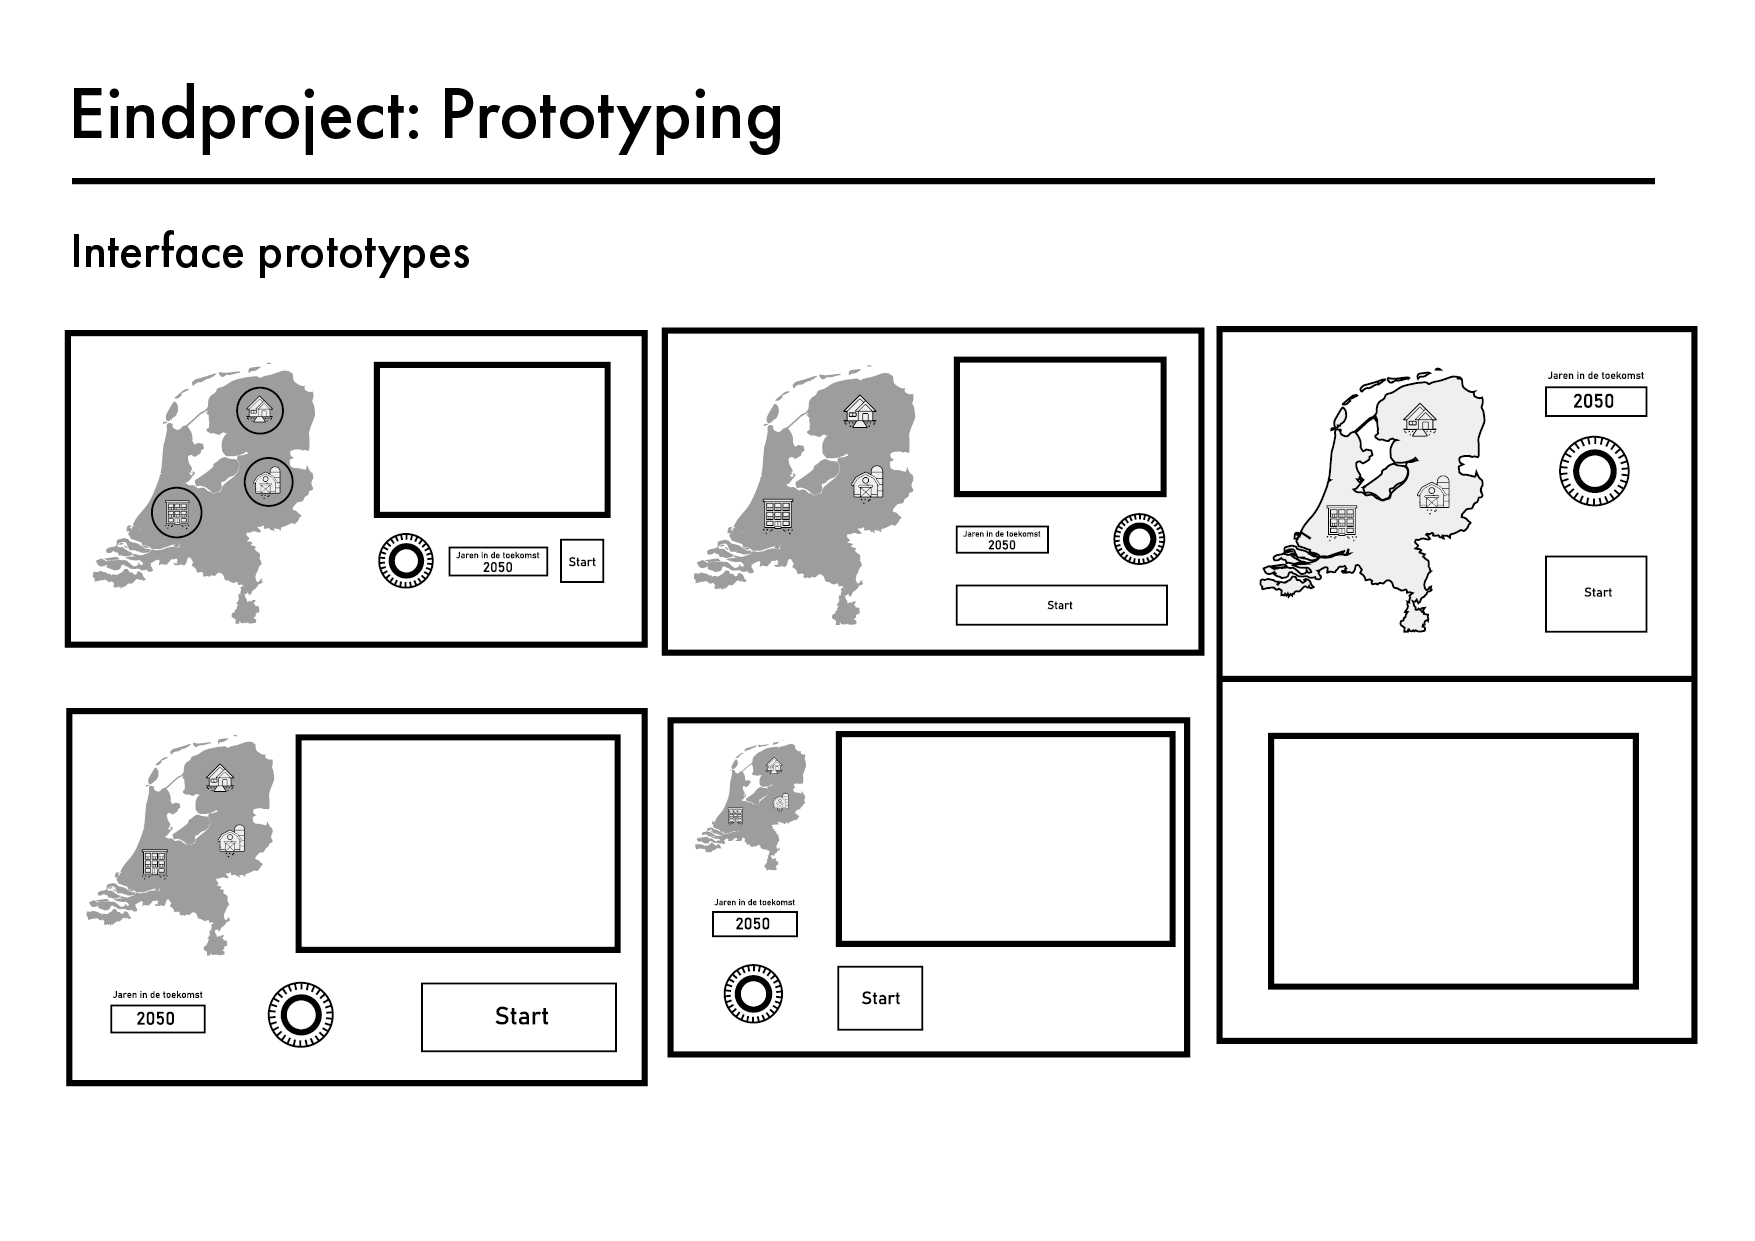
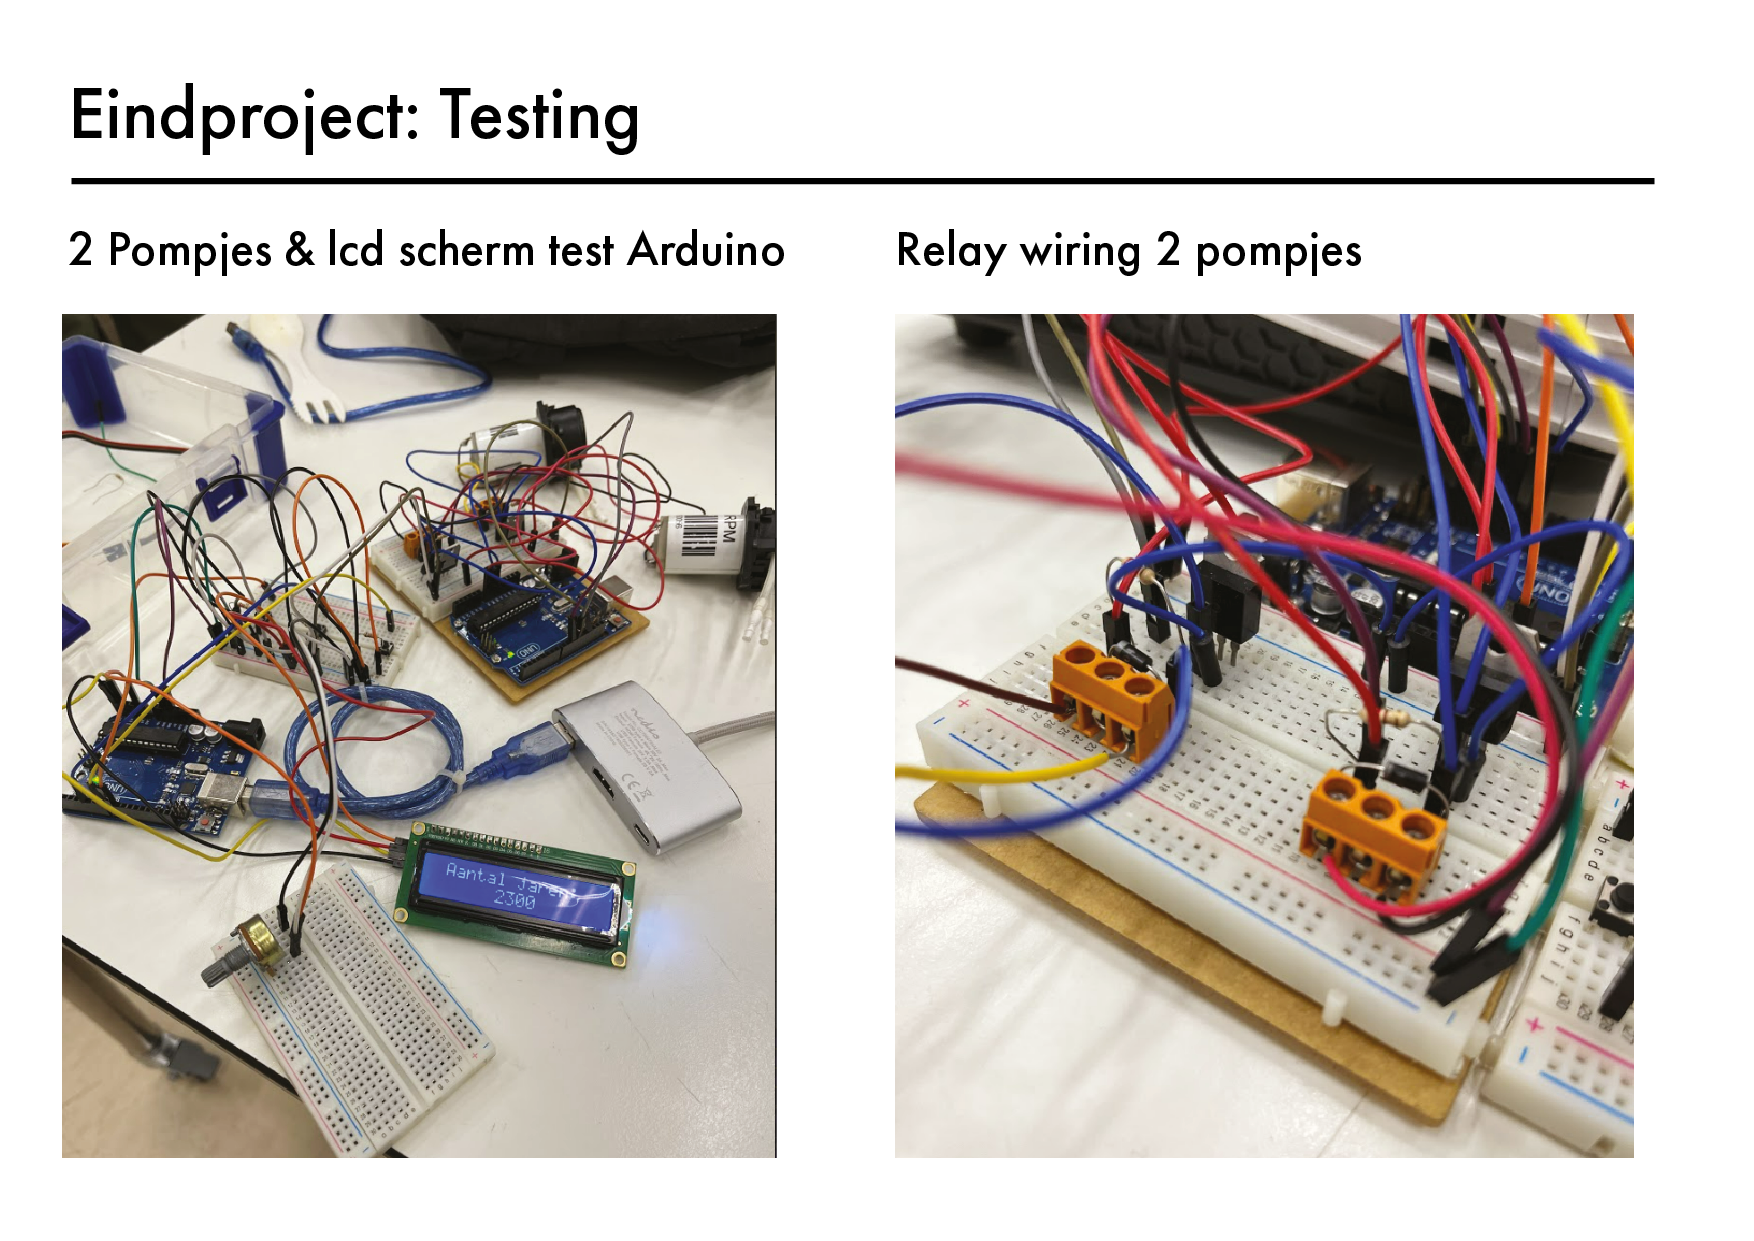
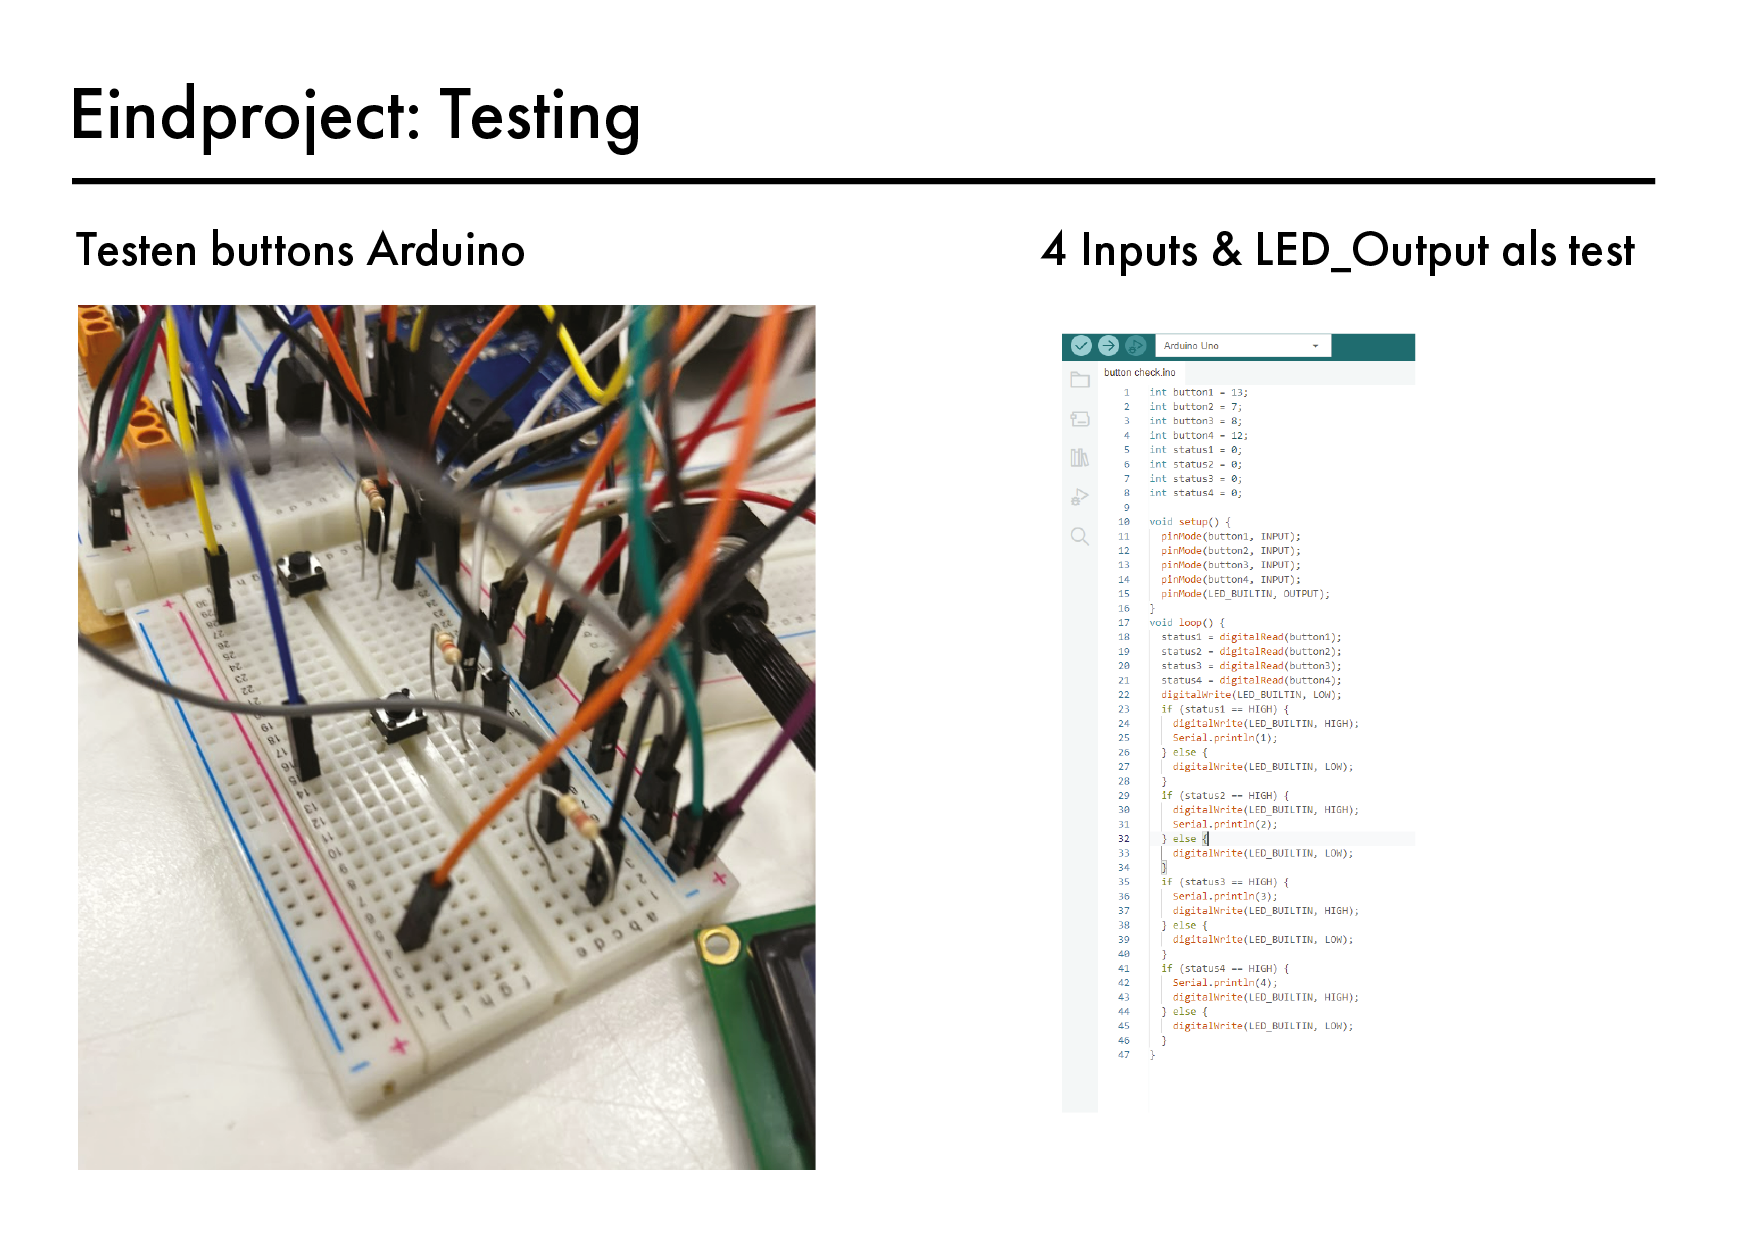
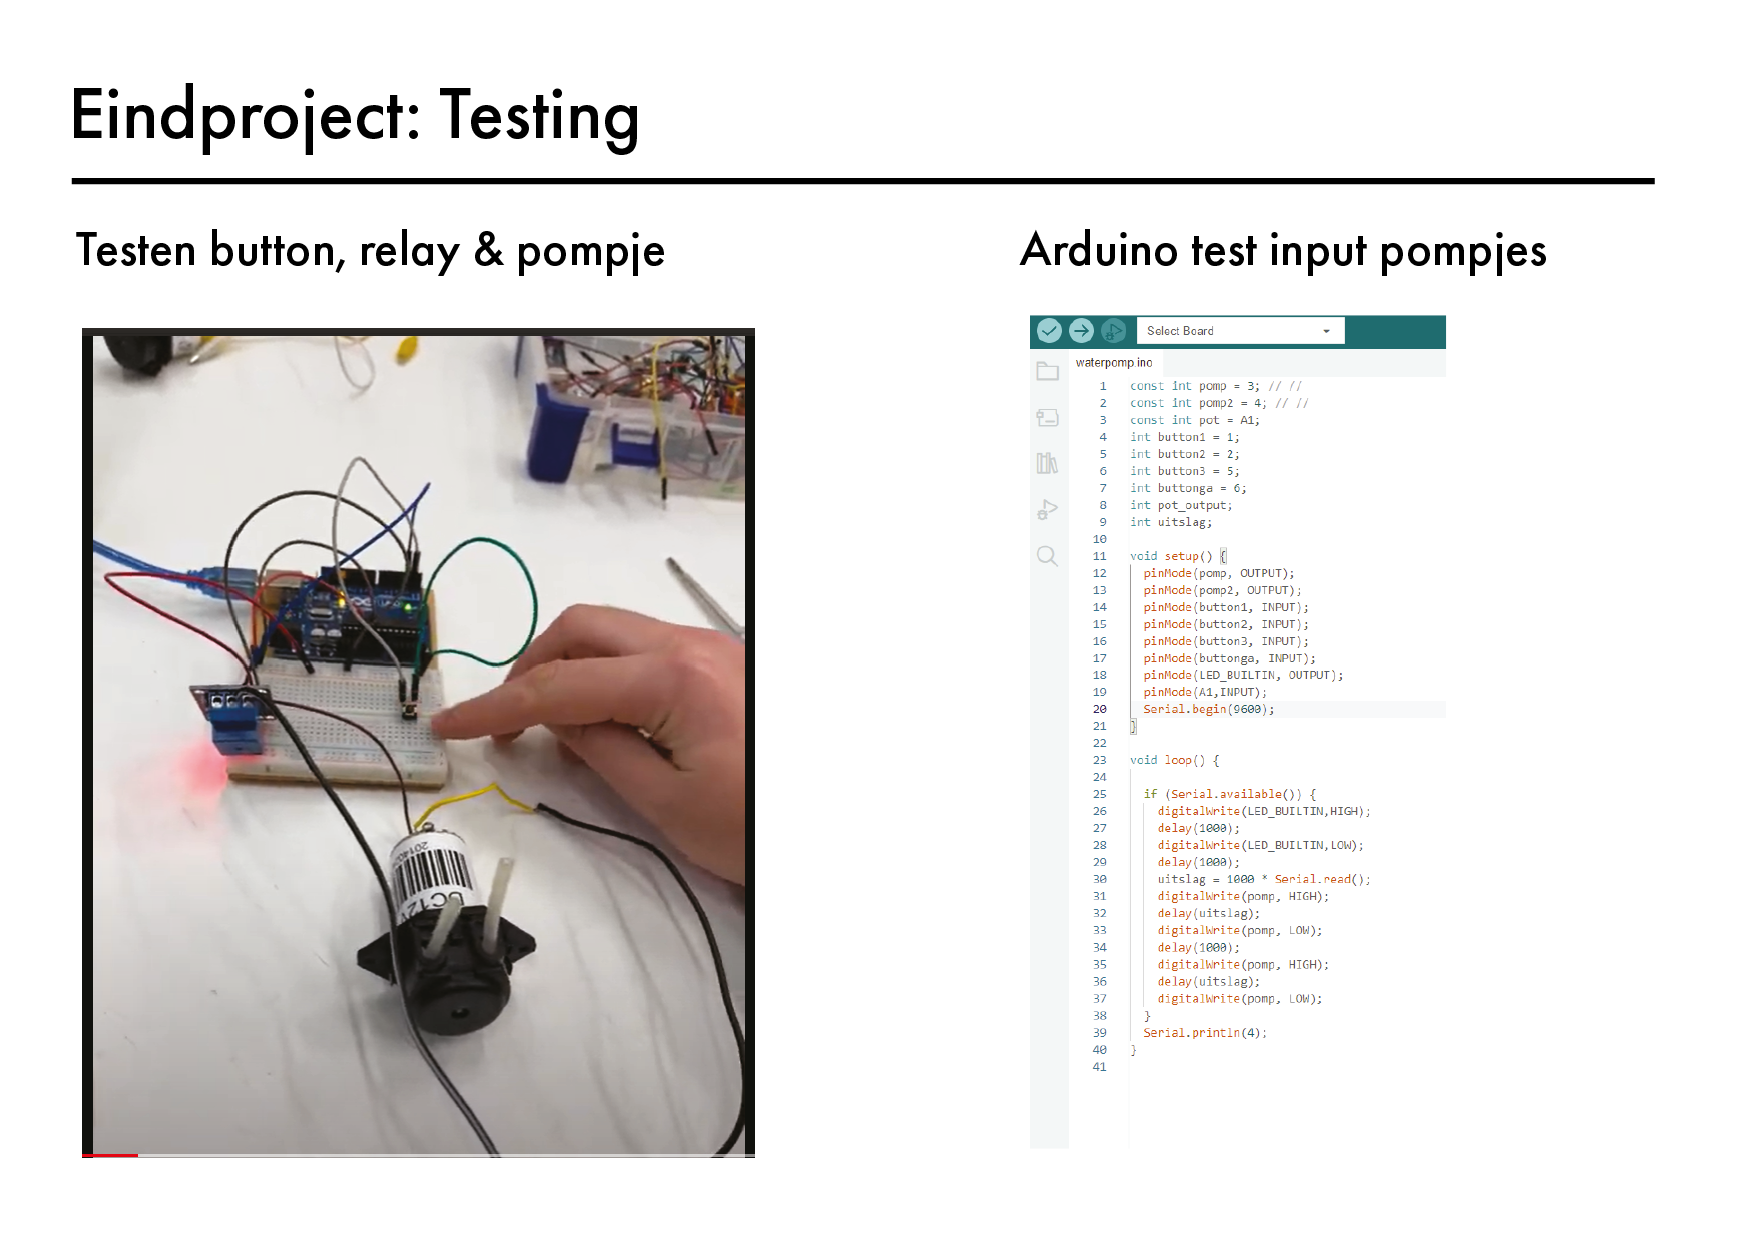
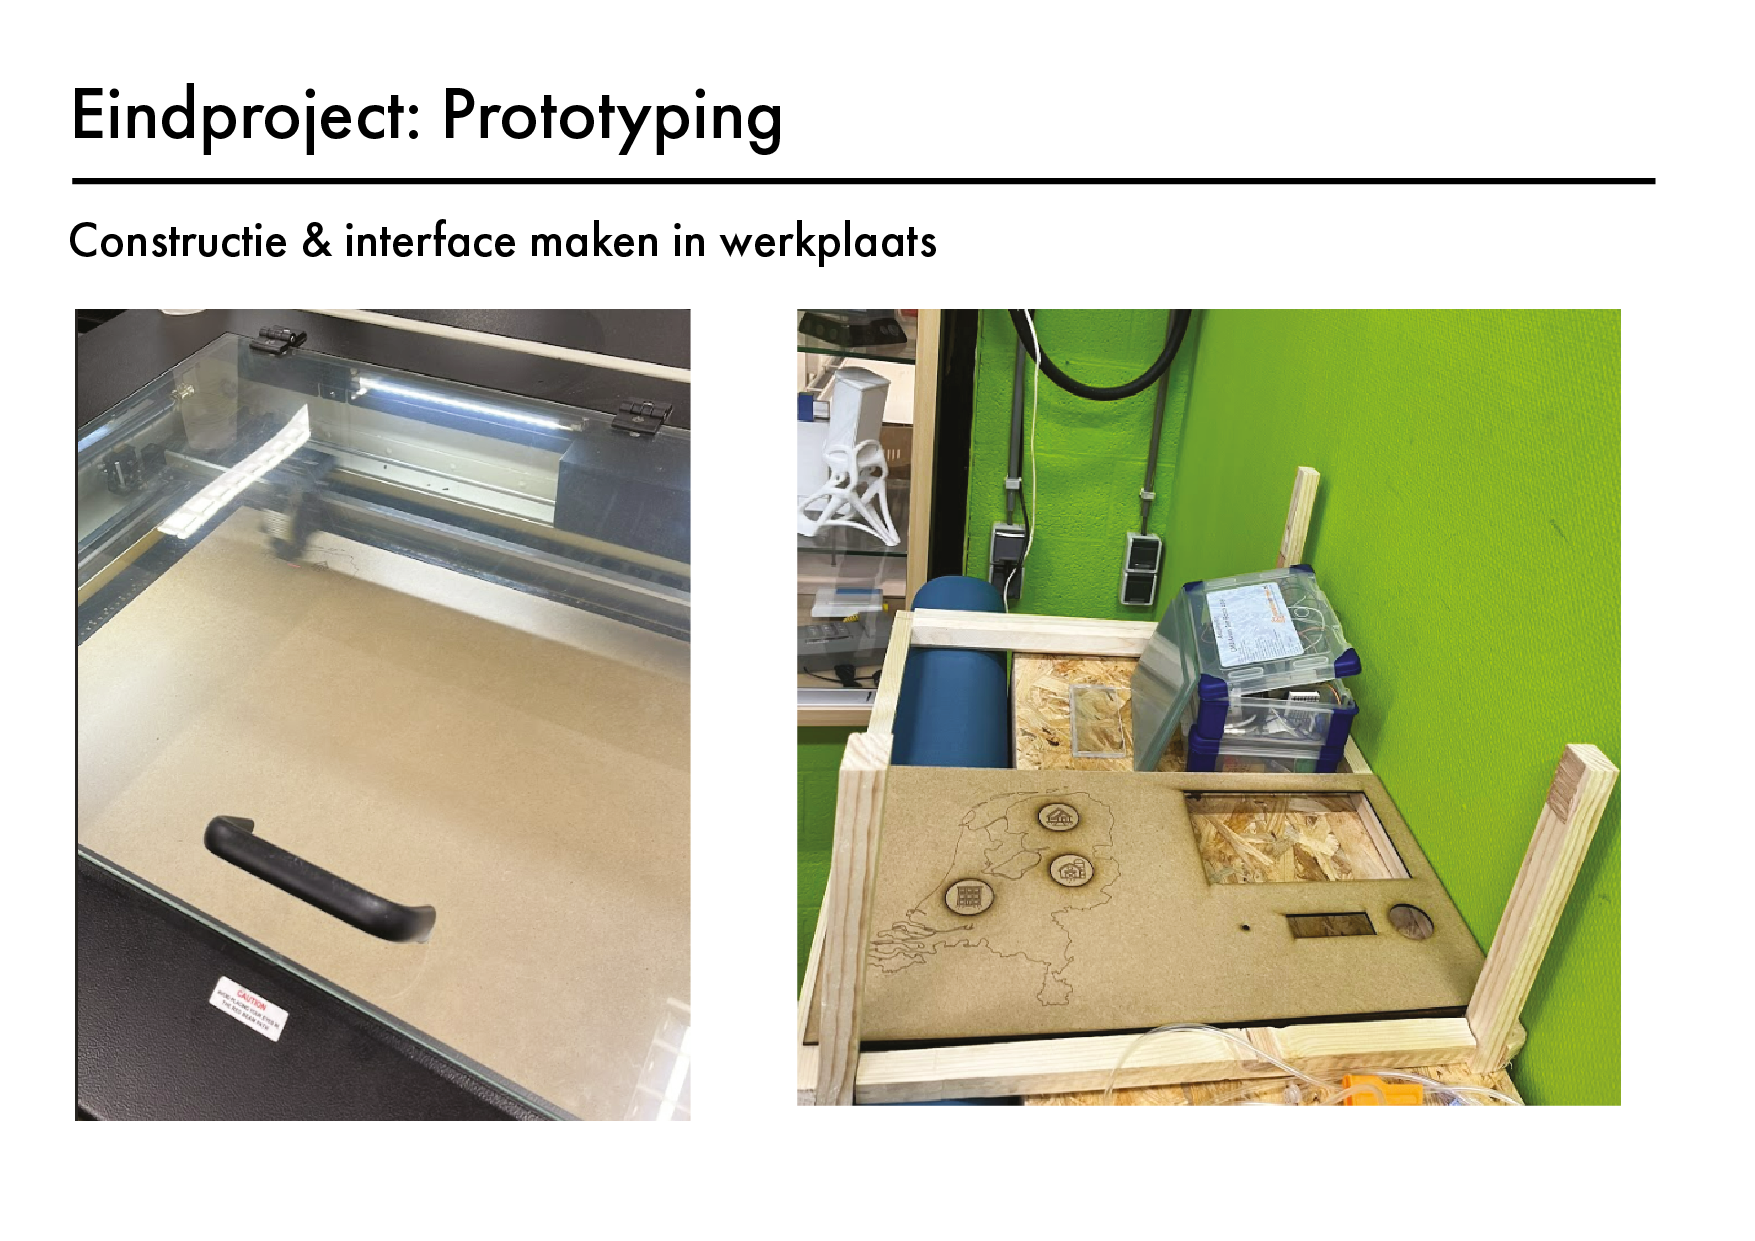
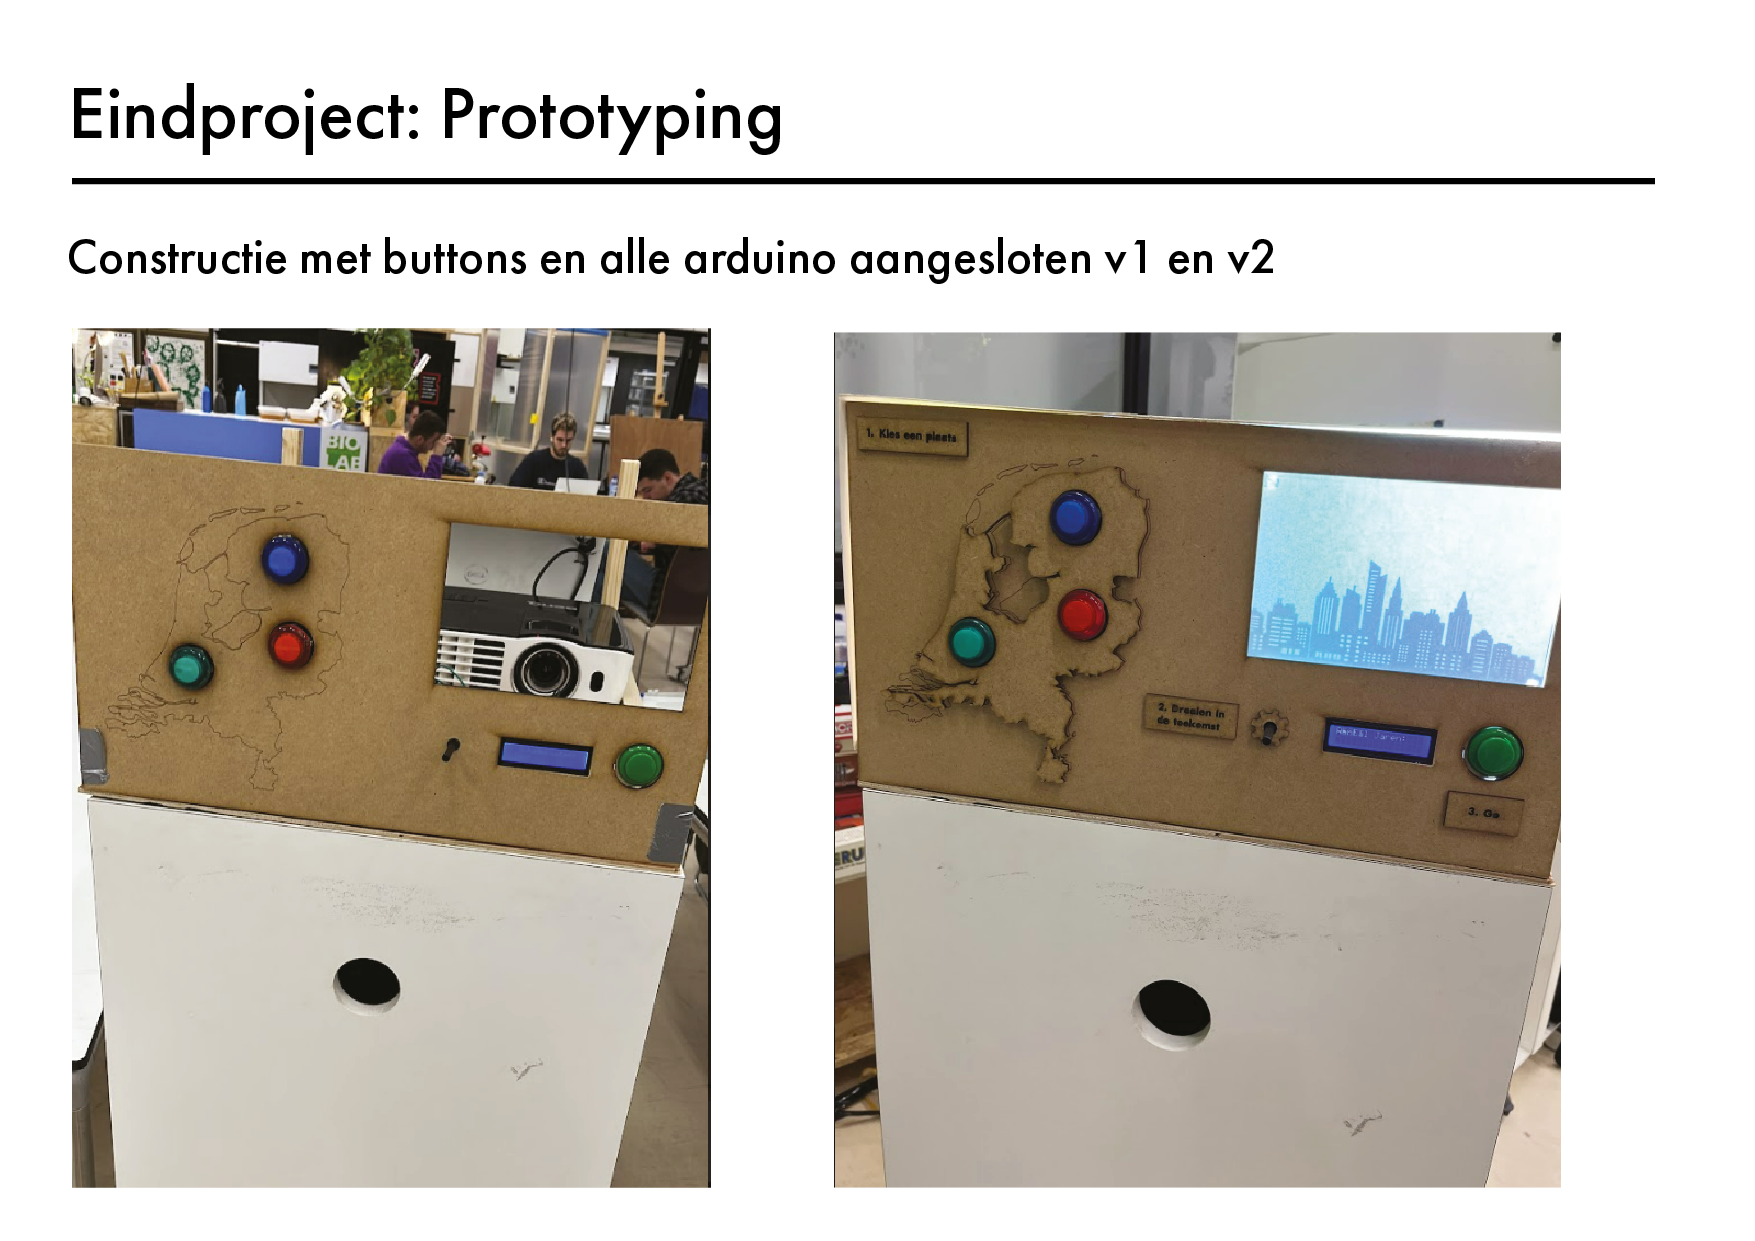
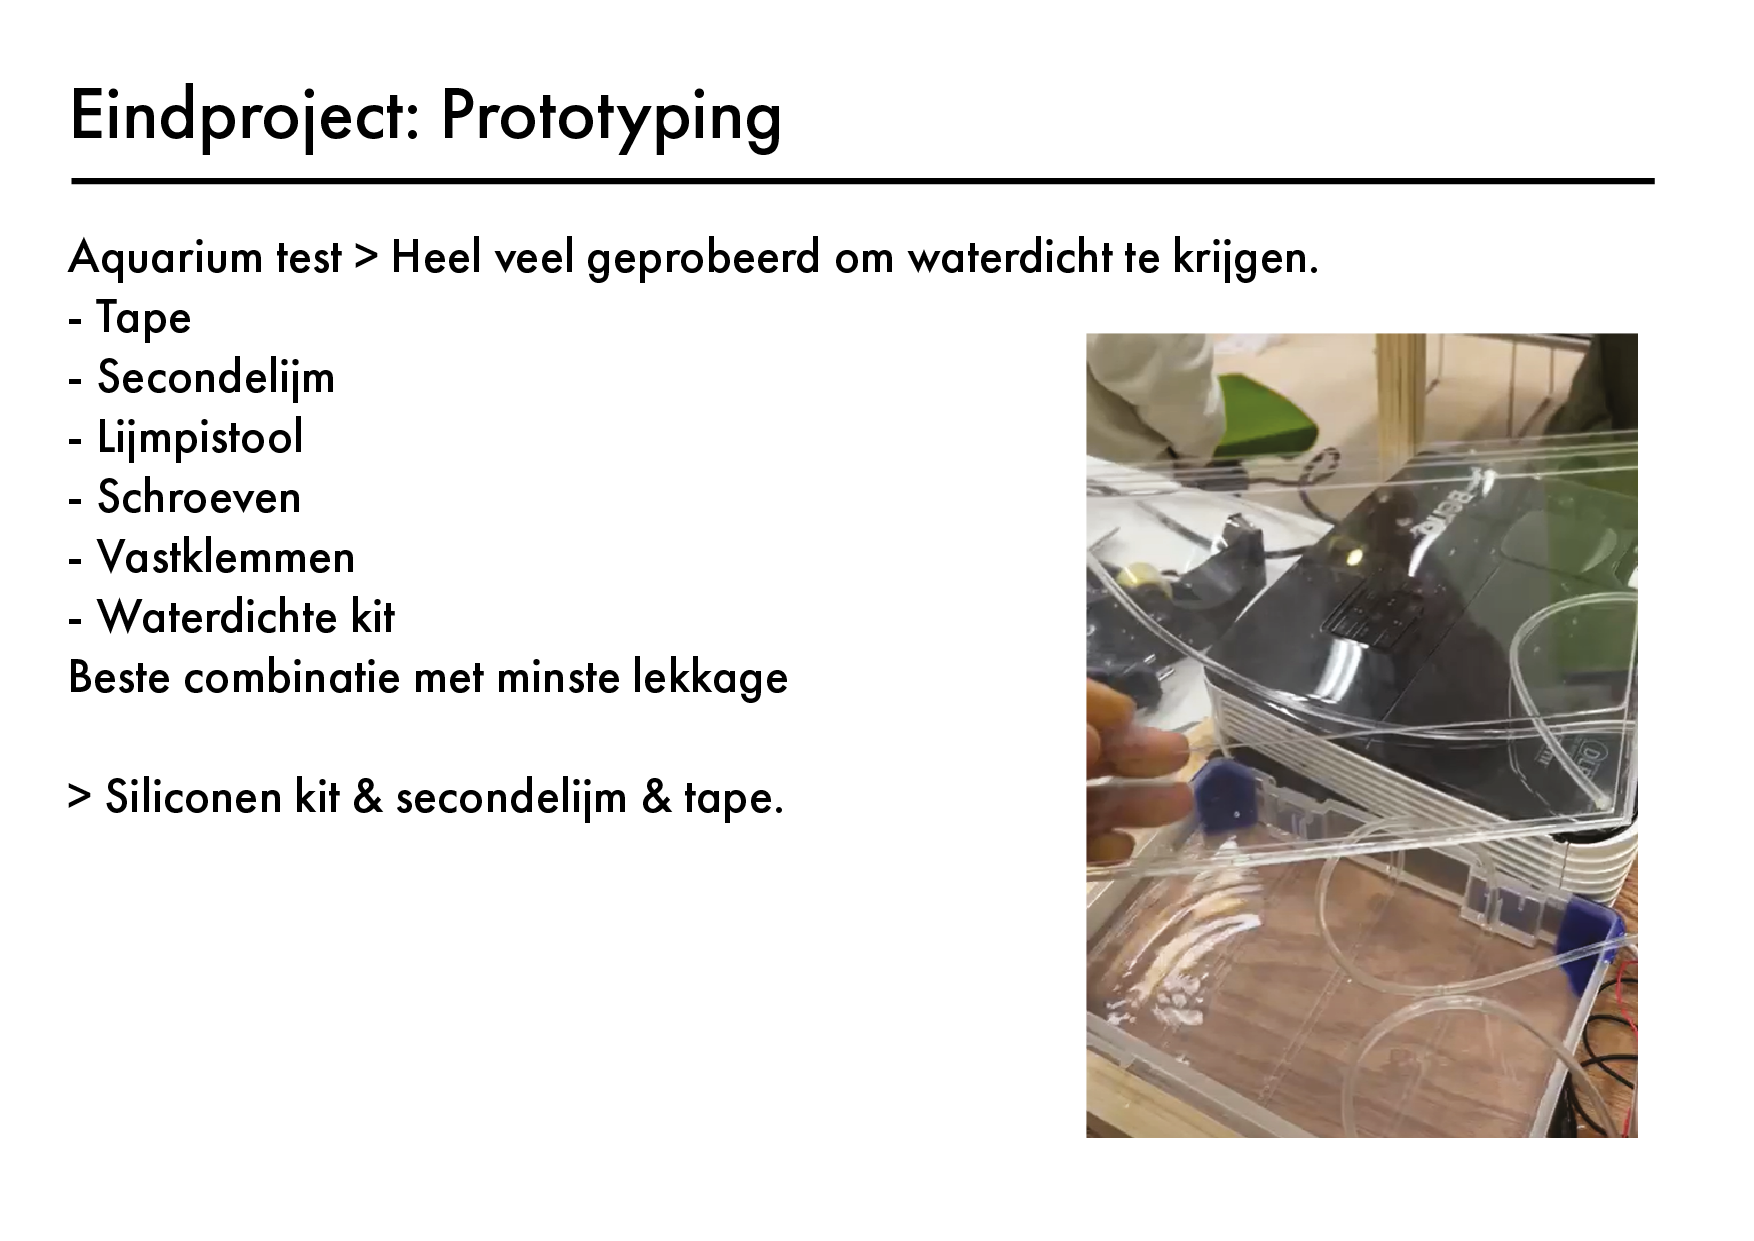
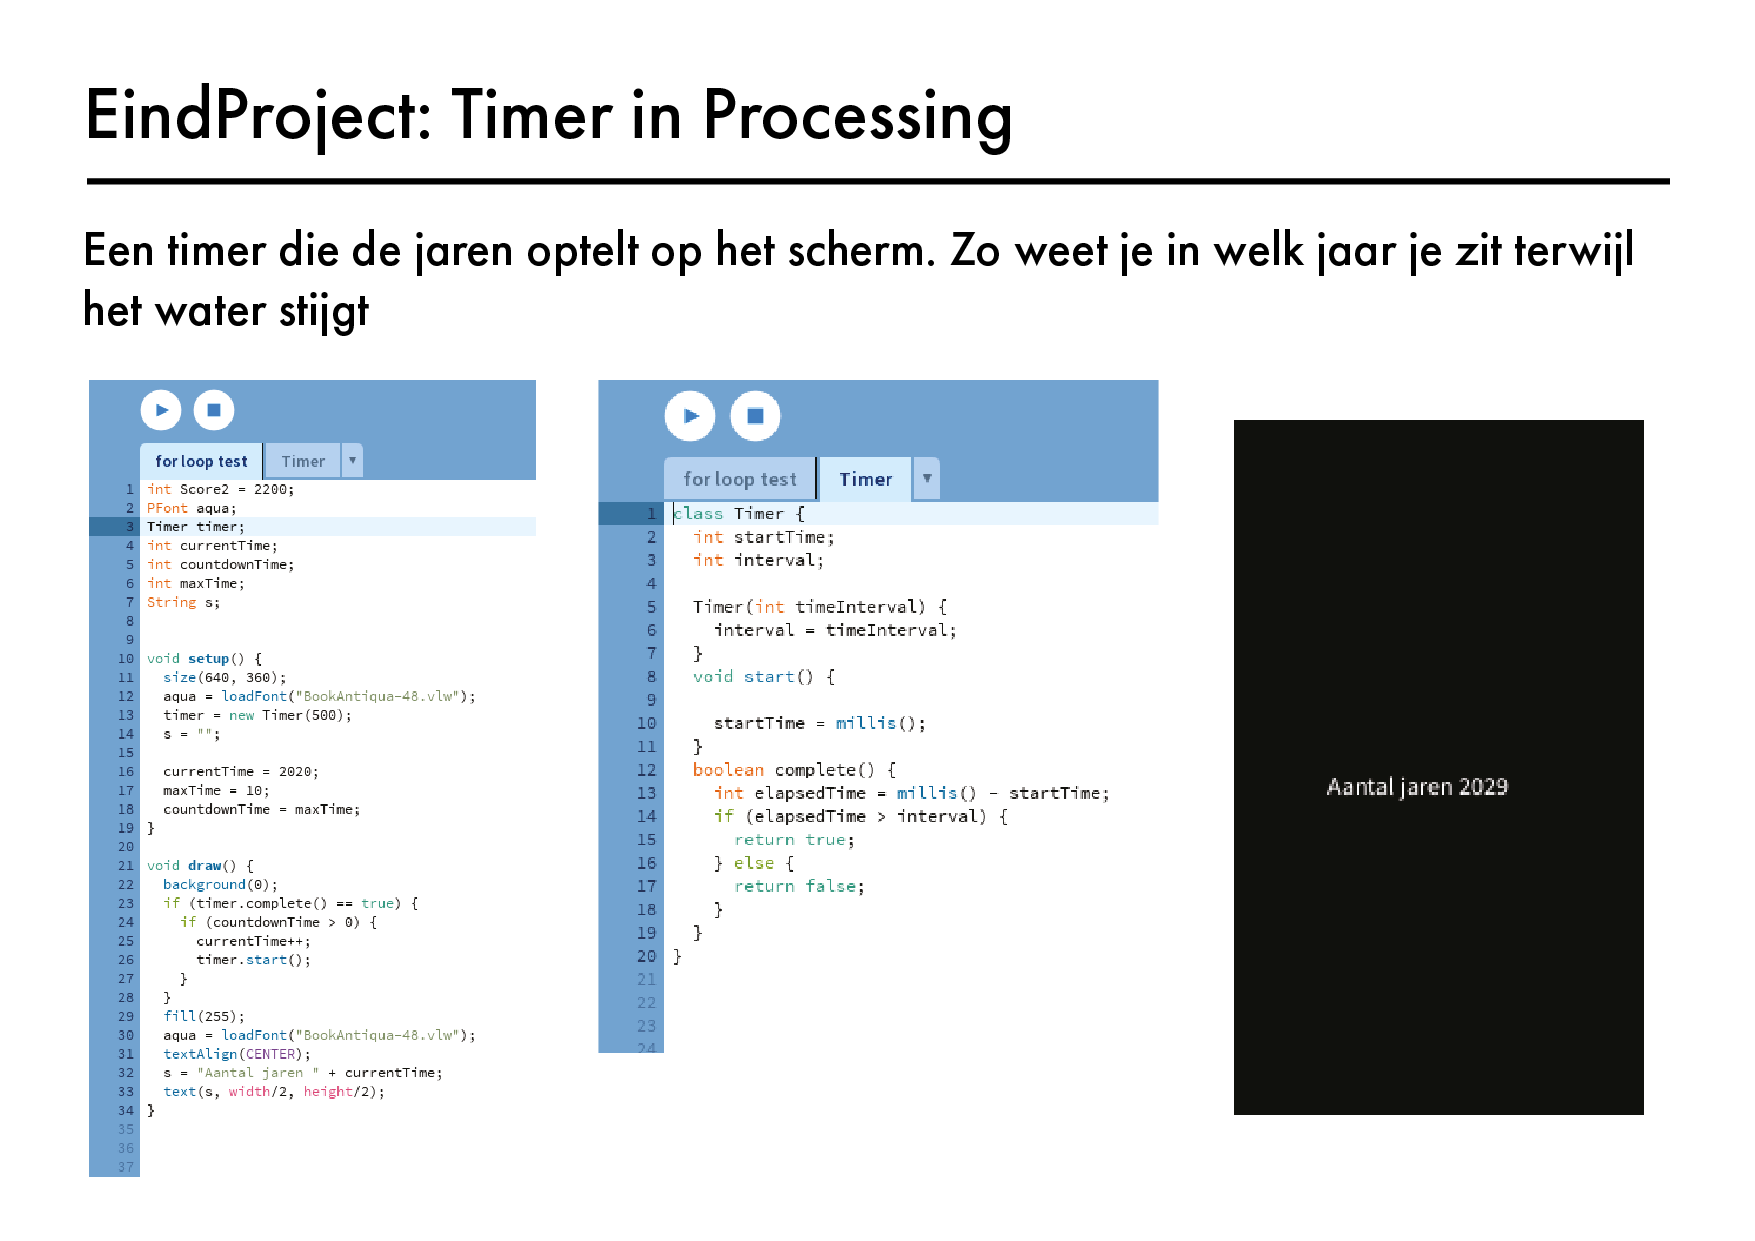
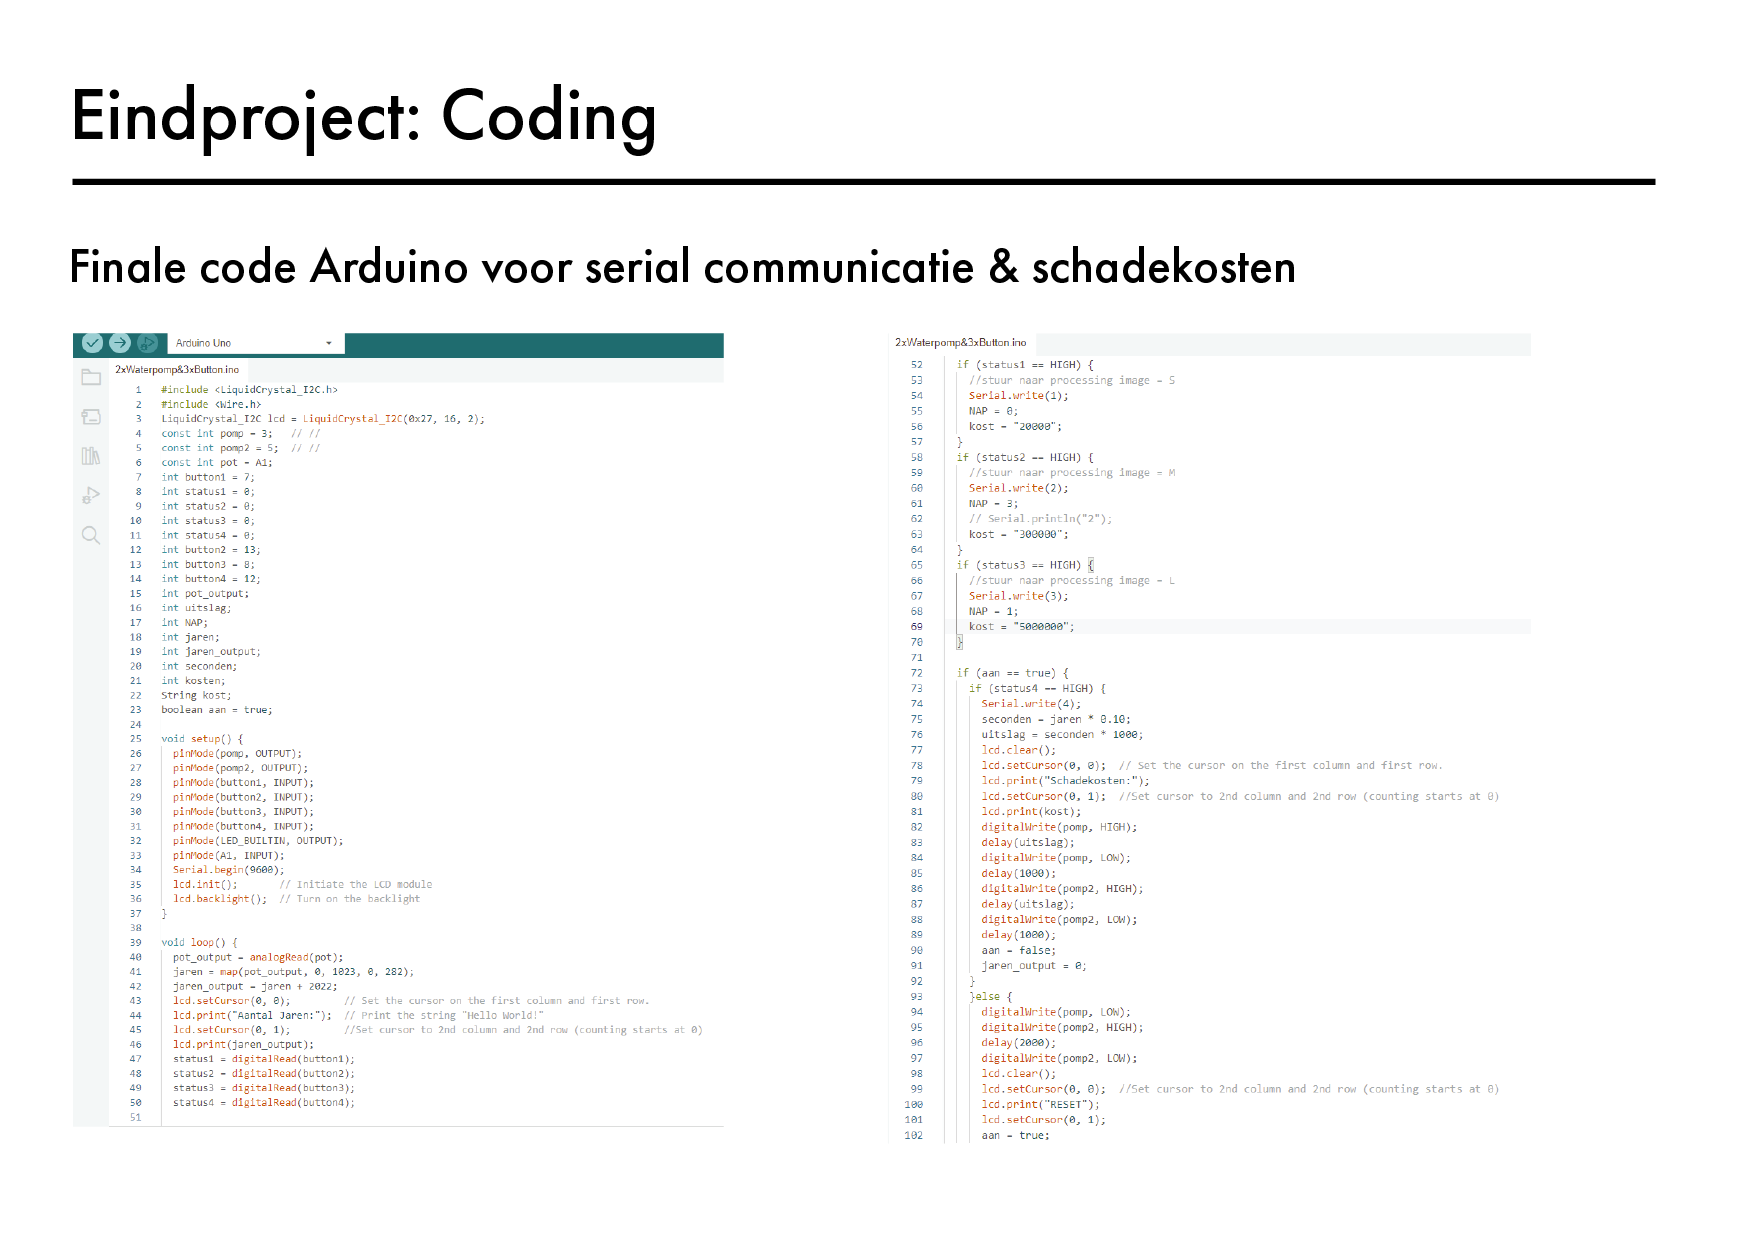
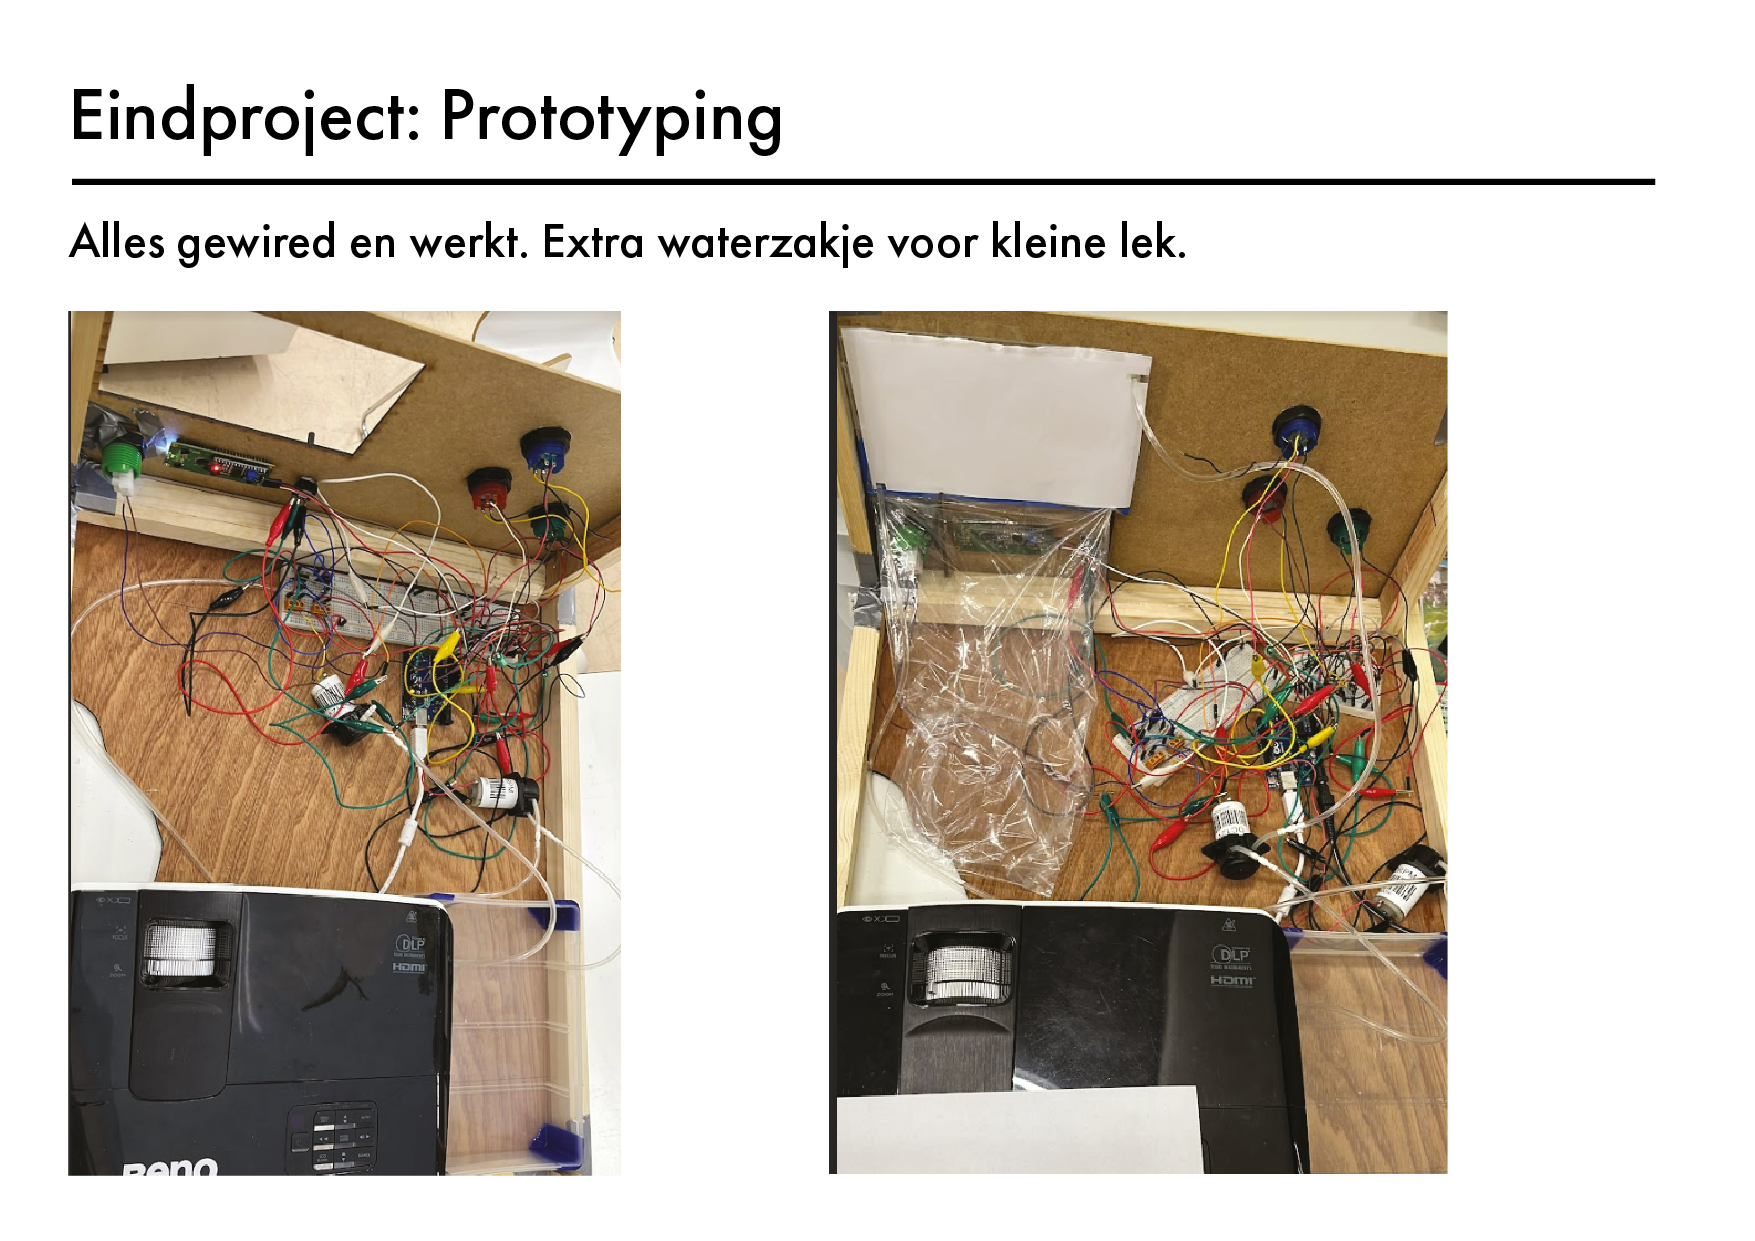
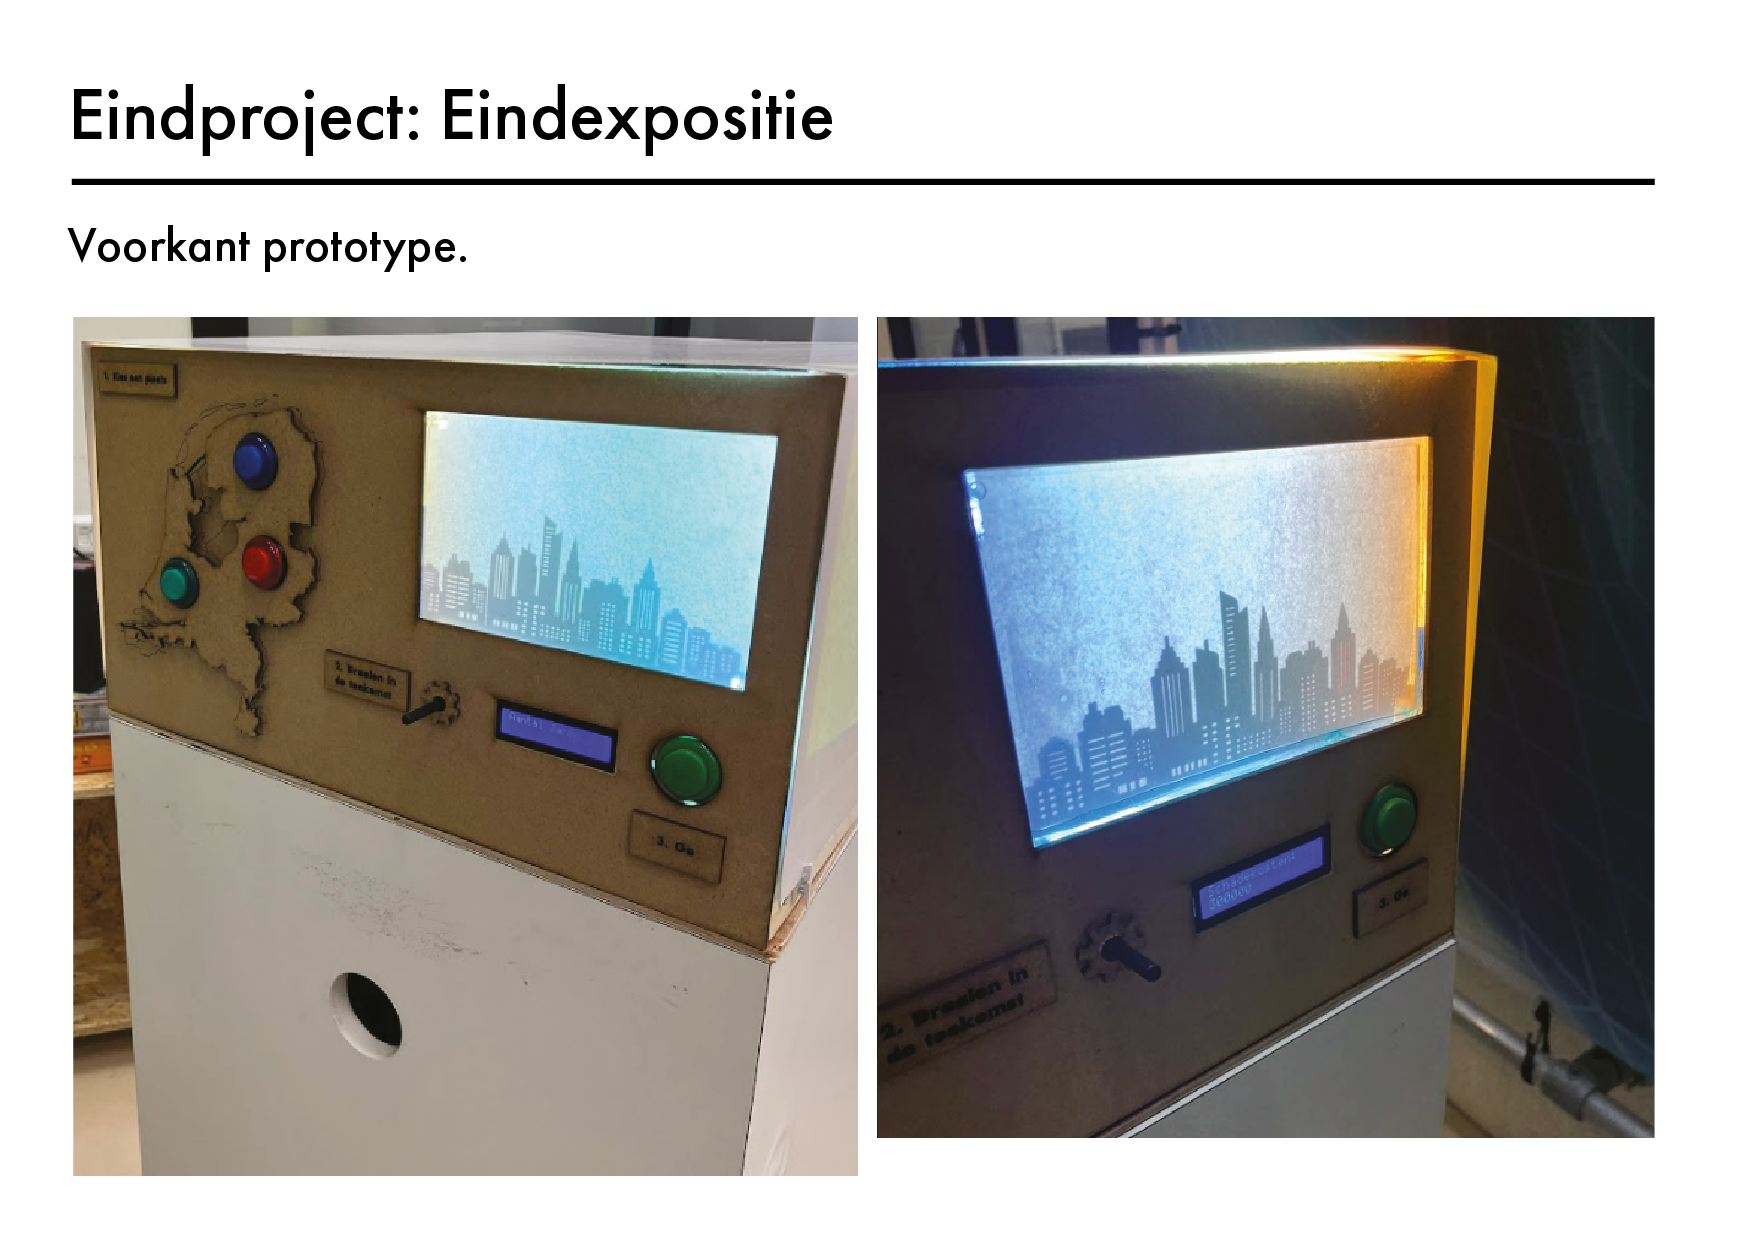
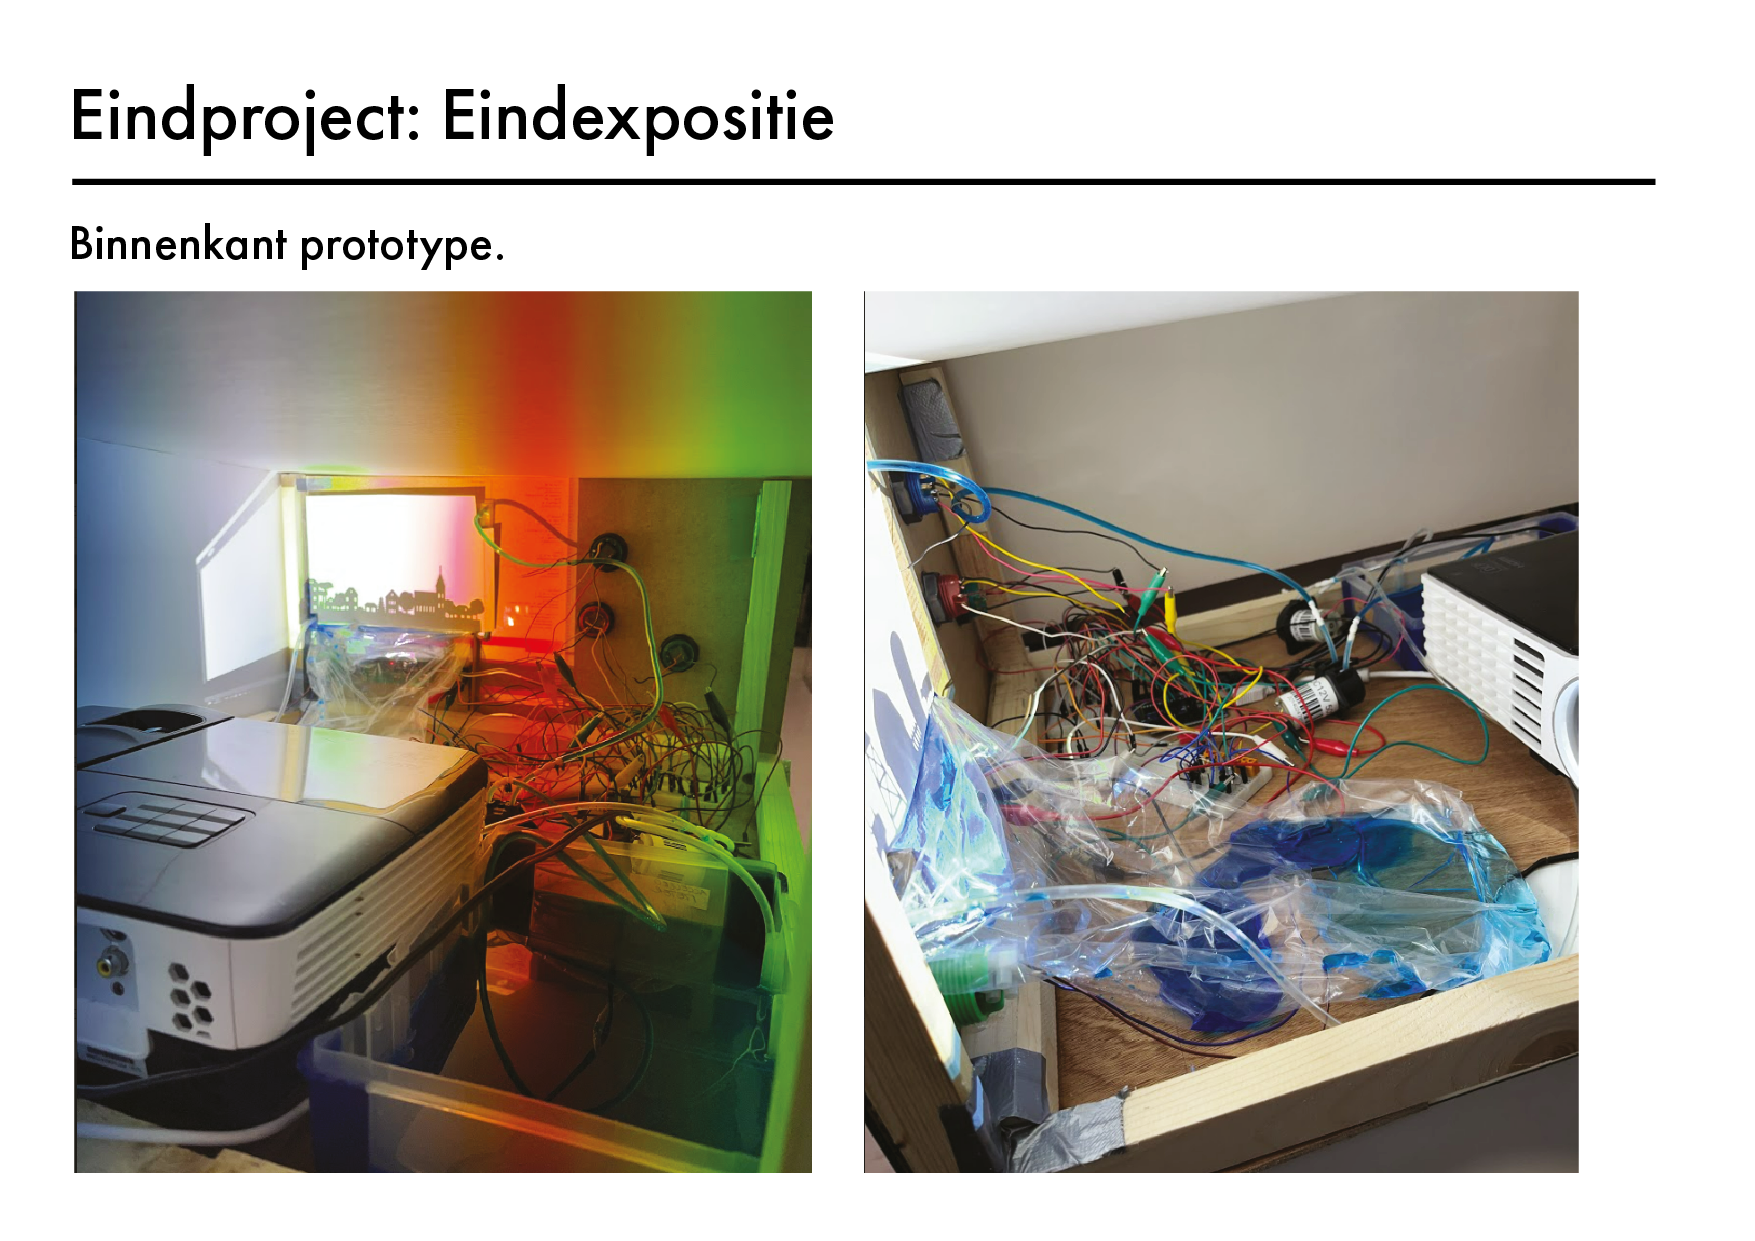
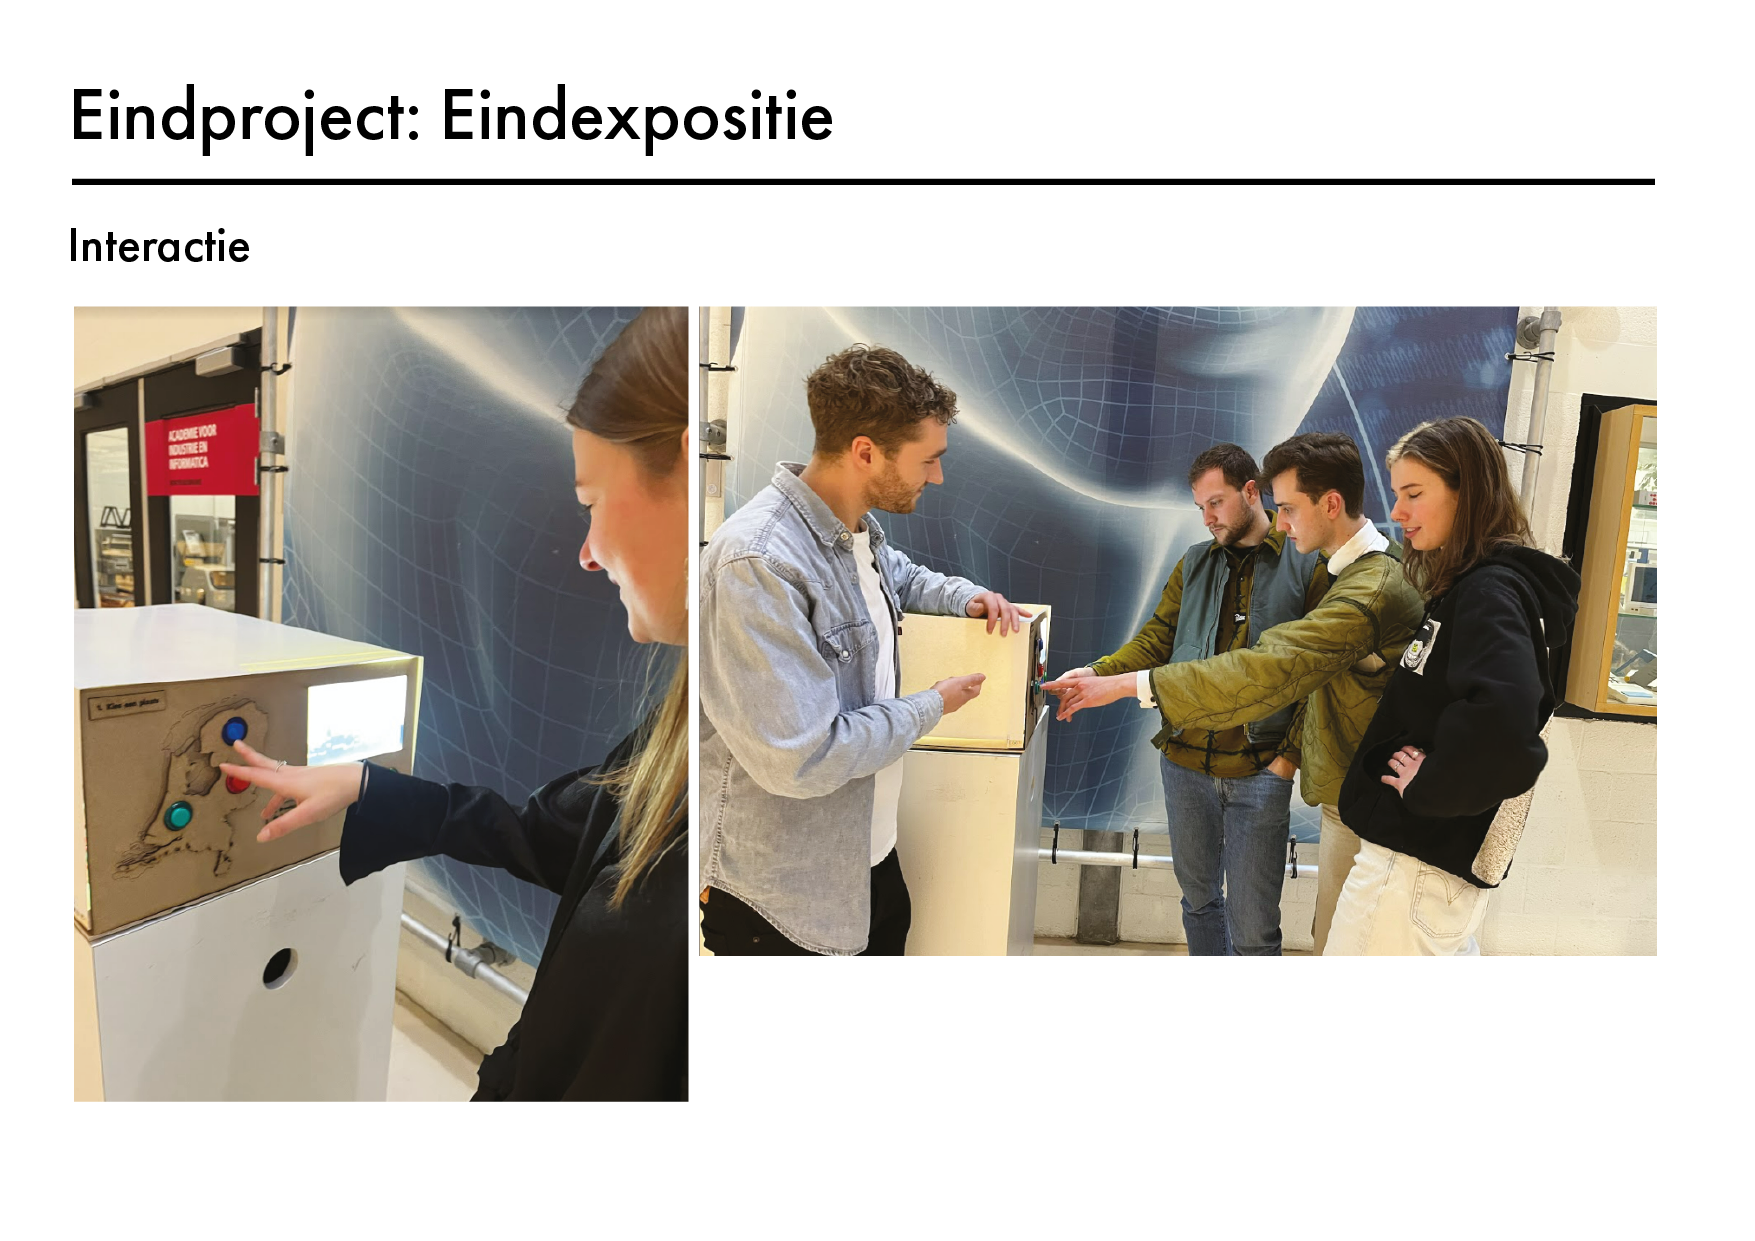
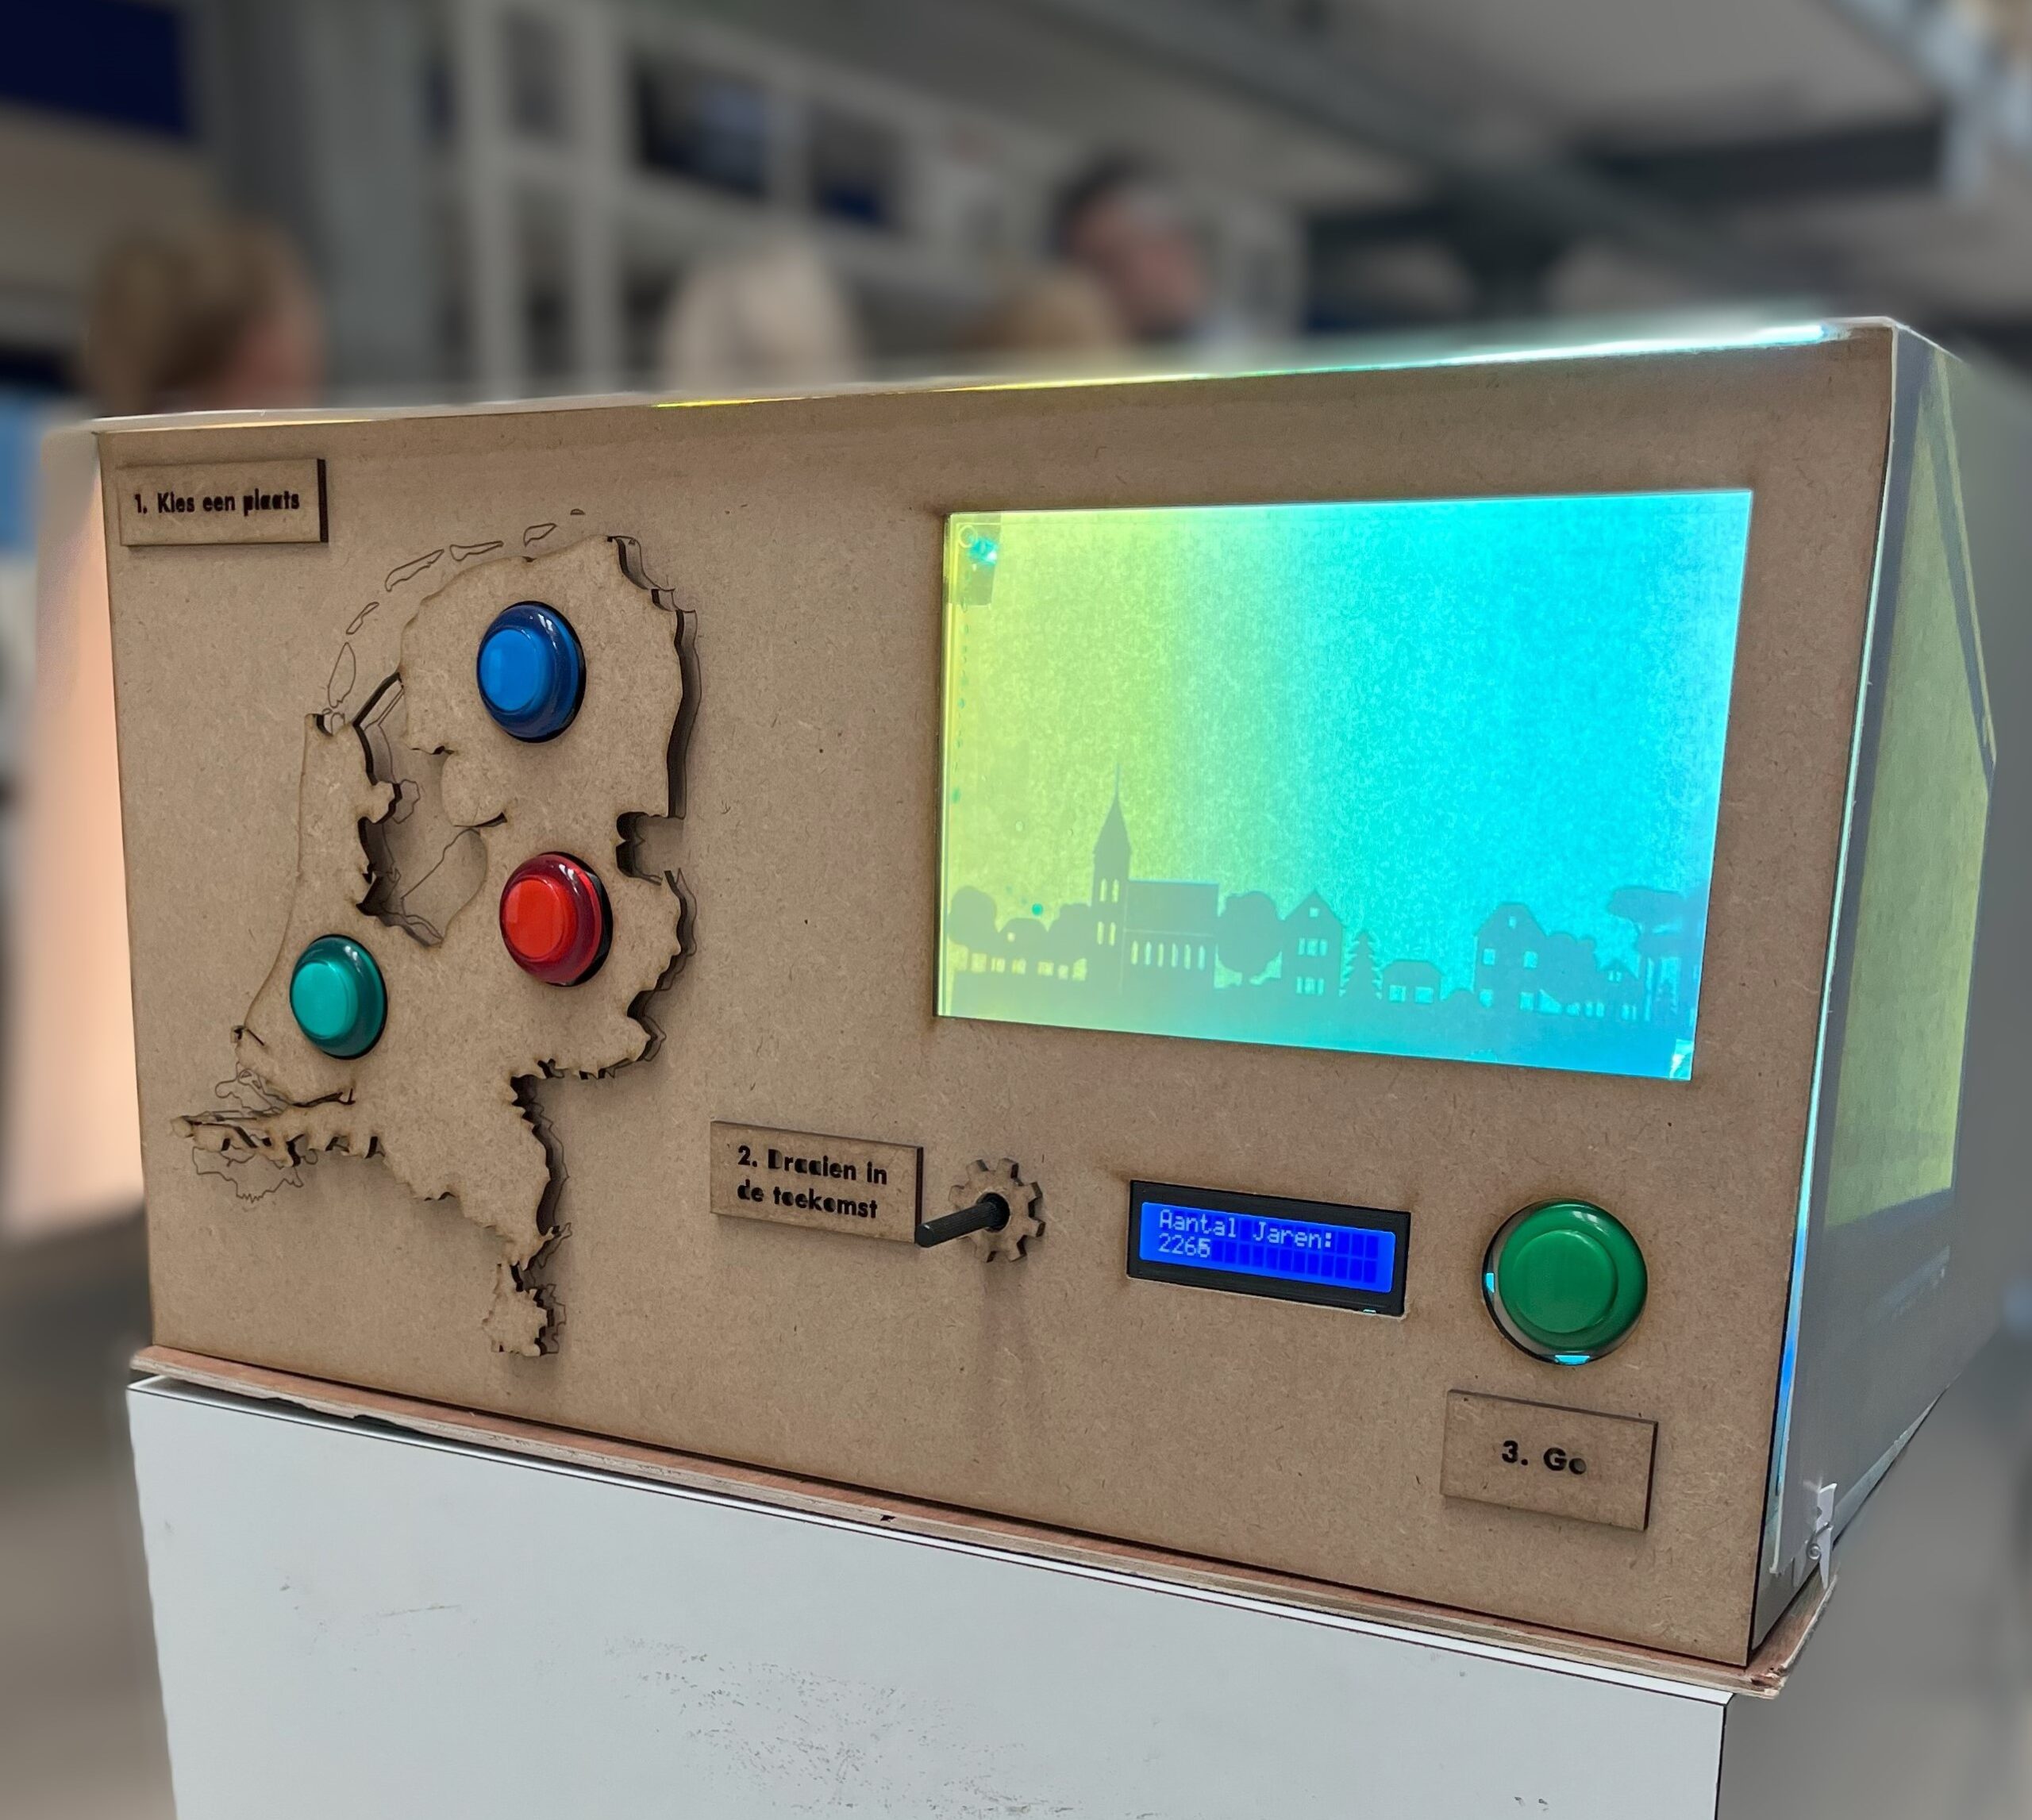
This Physical Data Visualization shows the rising water levels in three different locations from now until 2300. The construction pumps real water into the projection screen based on how much the water level will rise for that time frame. Seeing the projected village drown in real water.
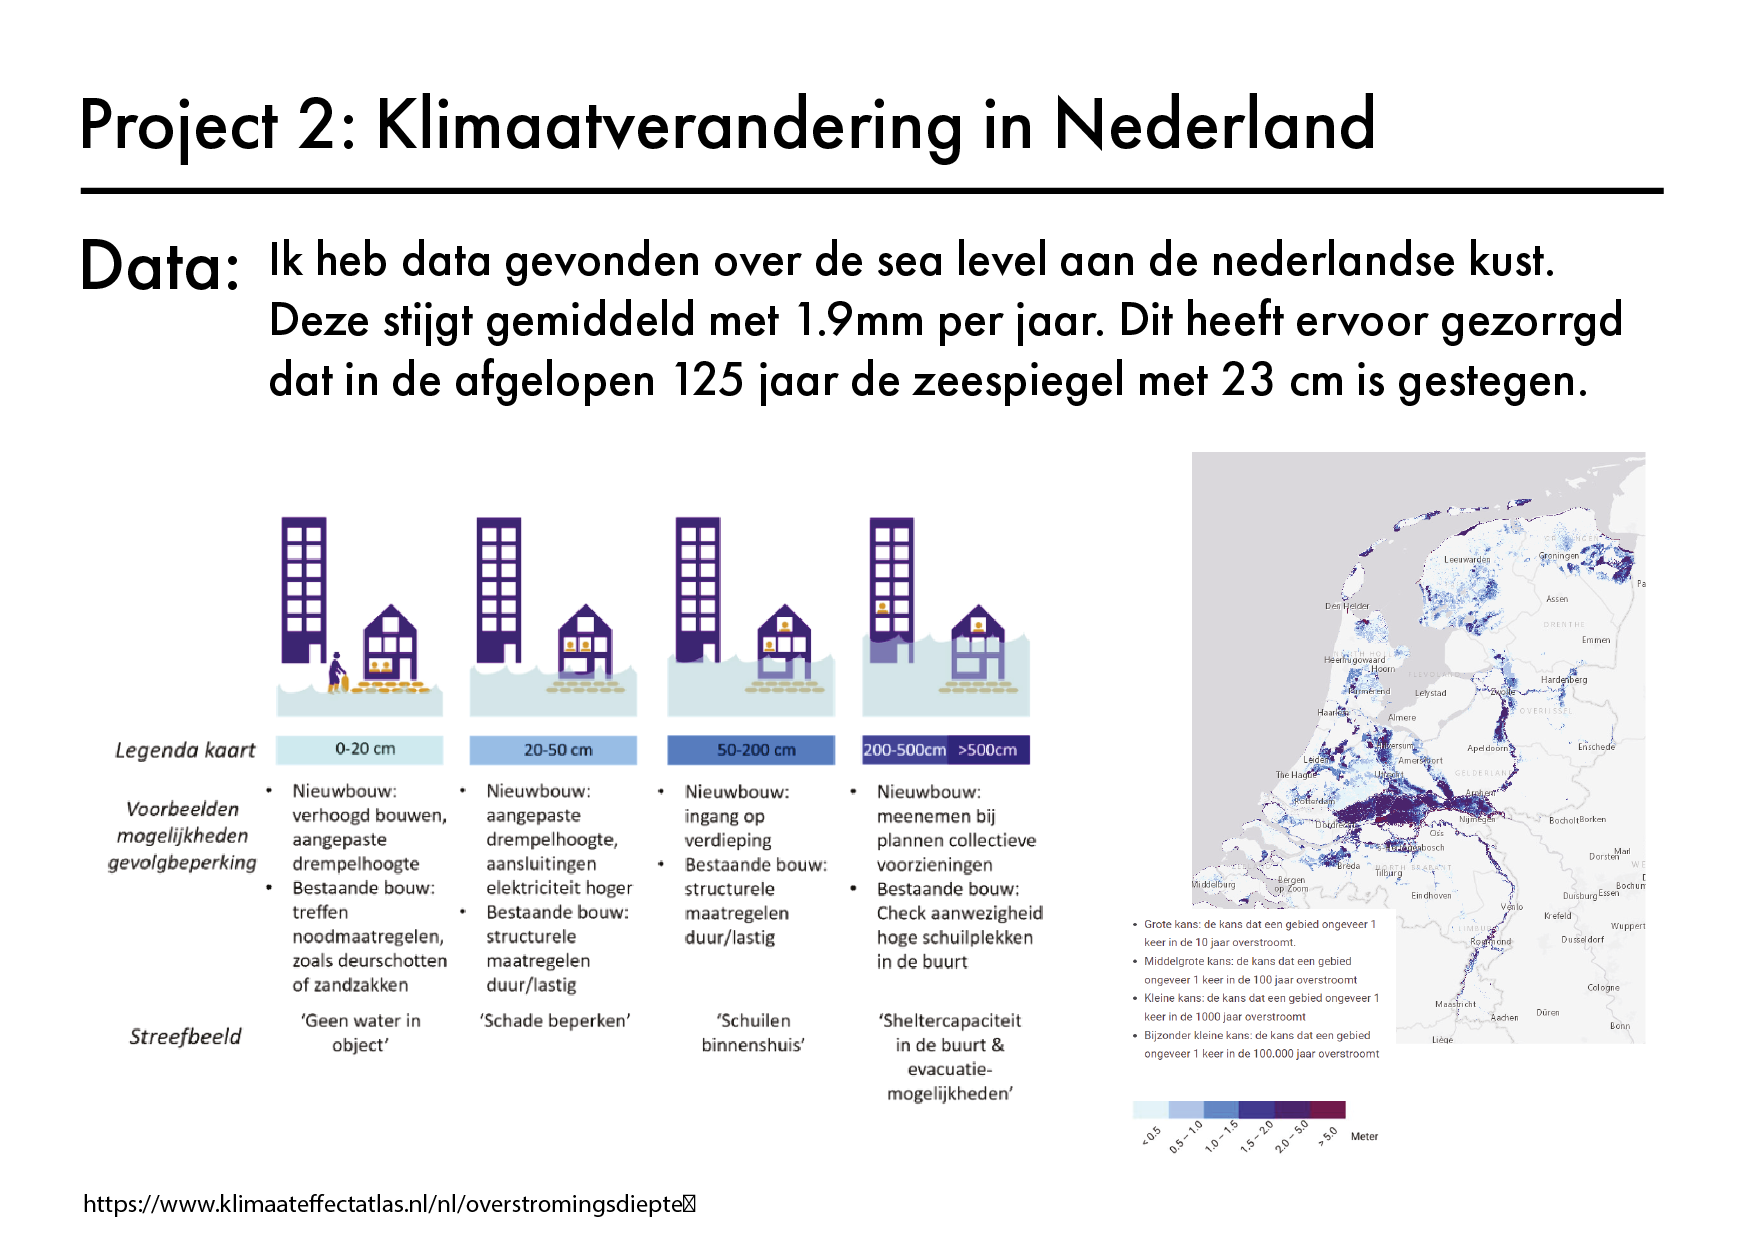
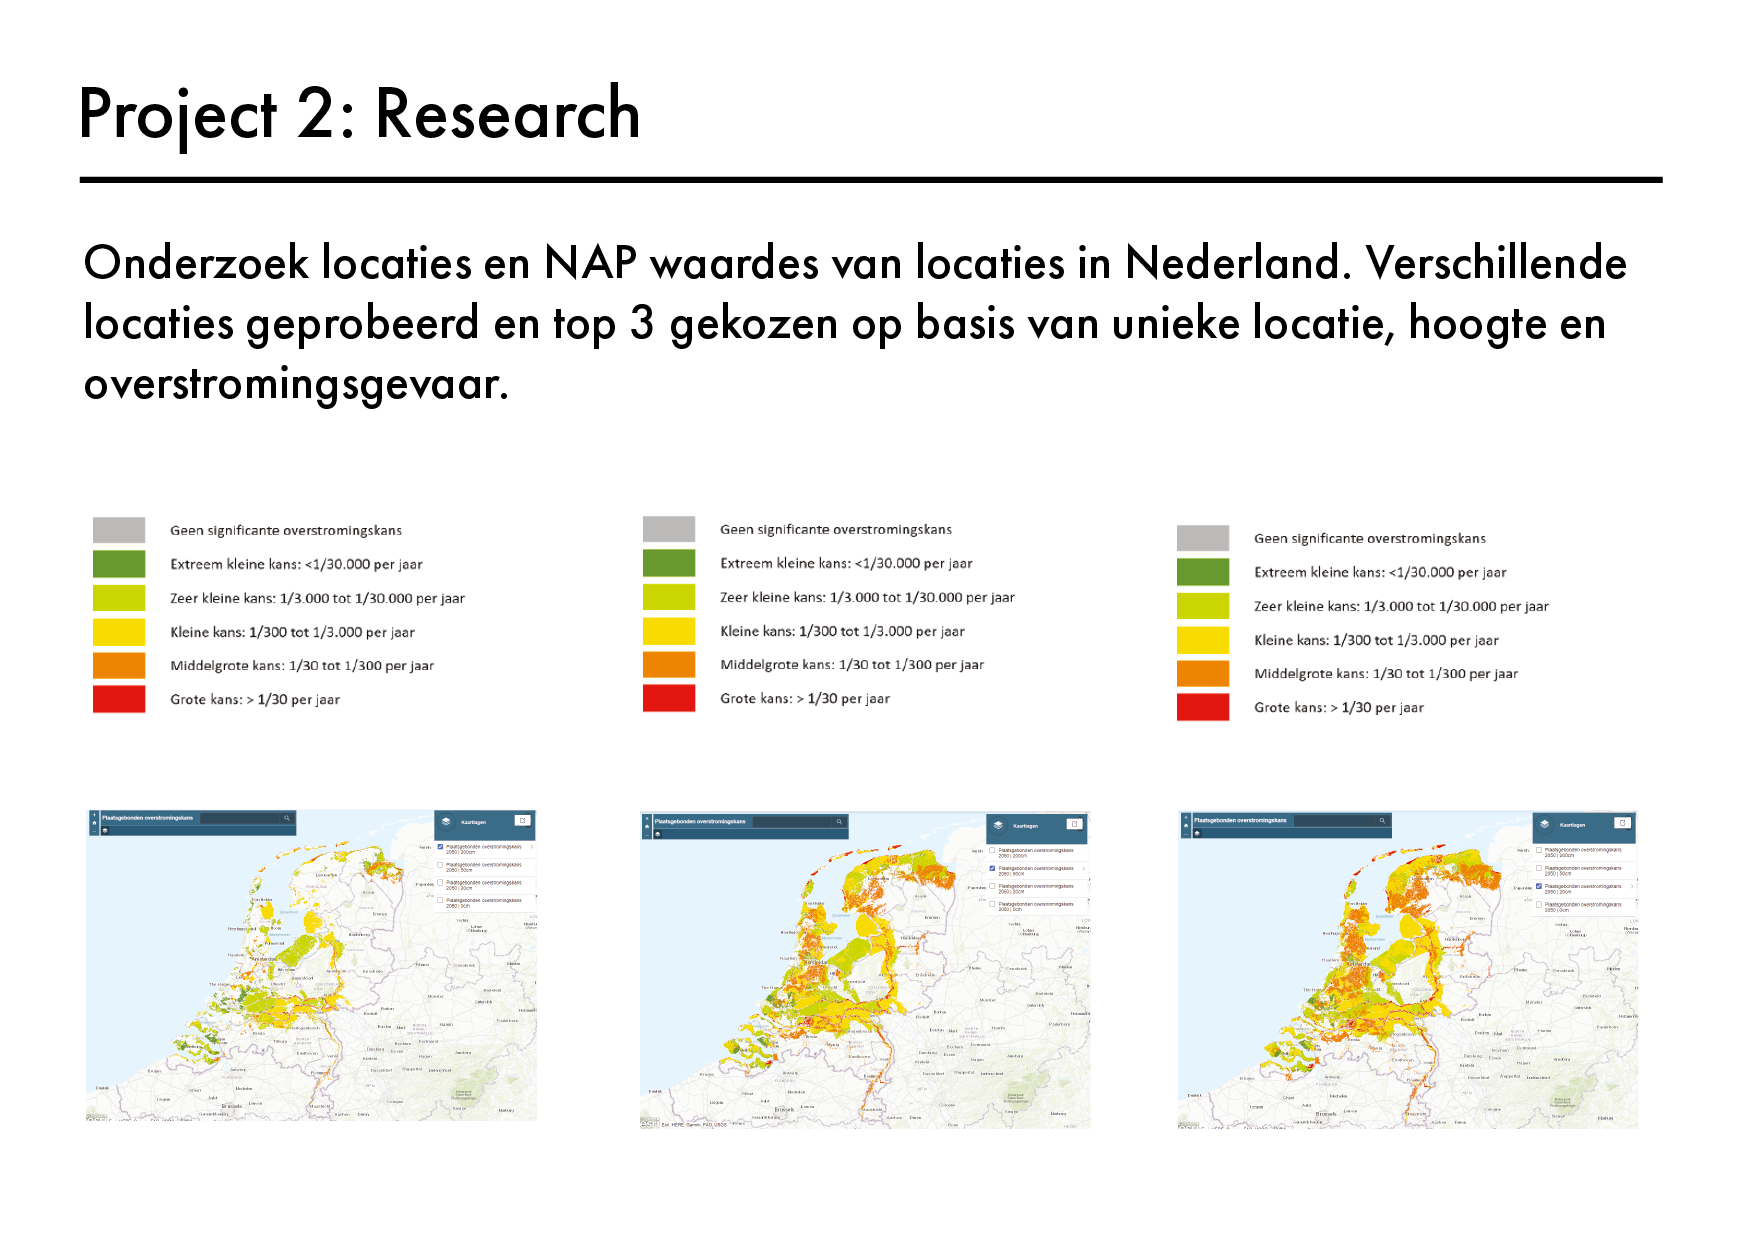
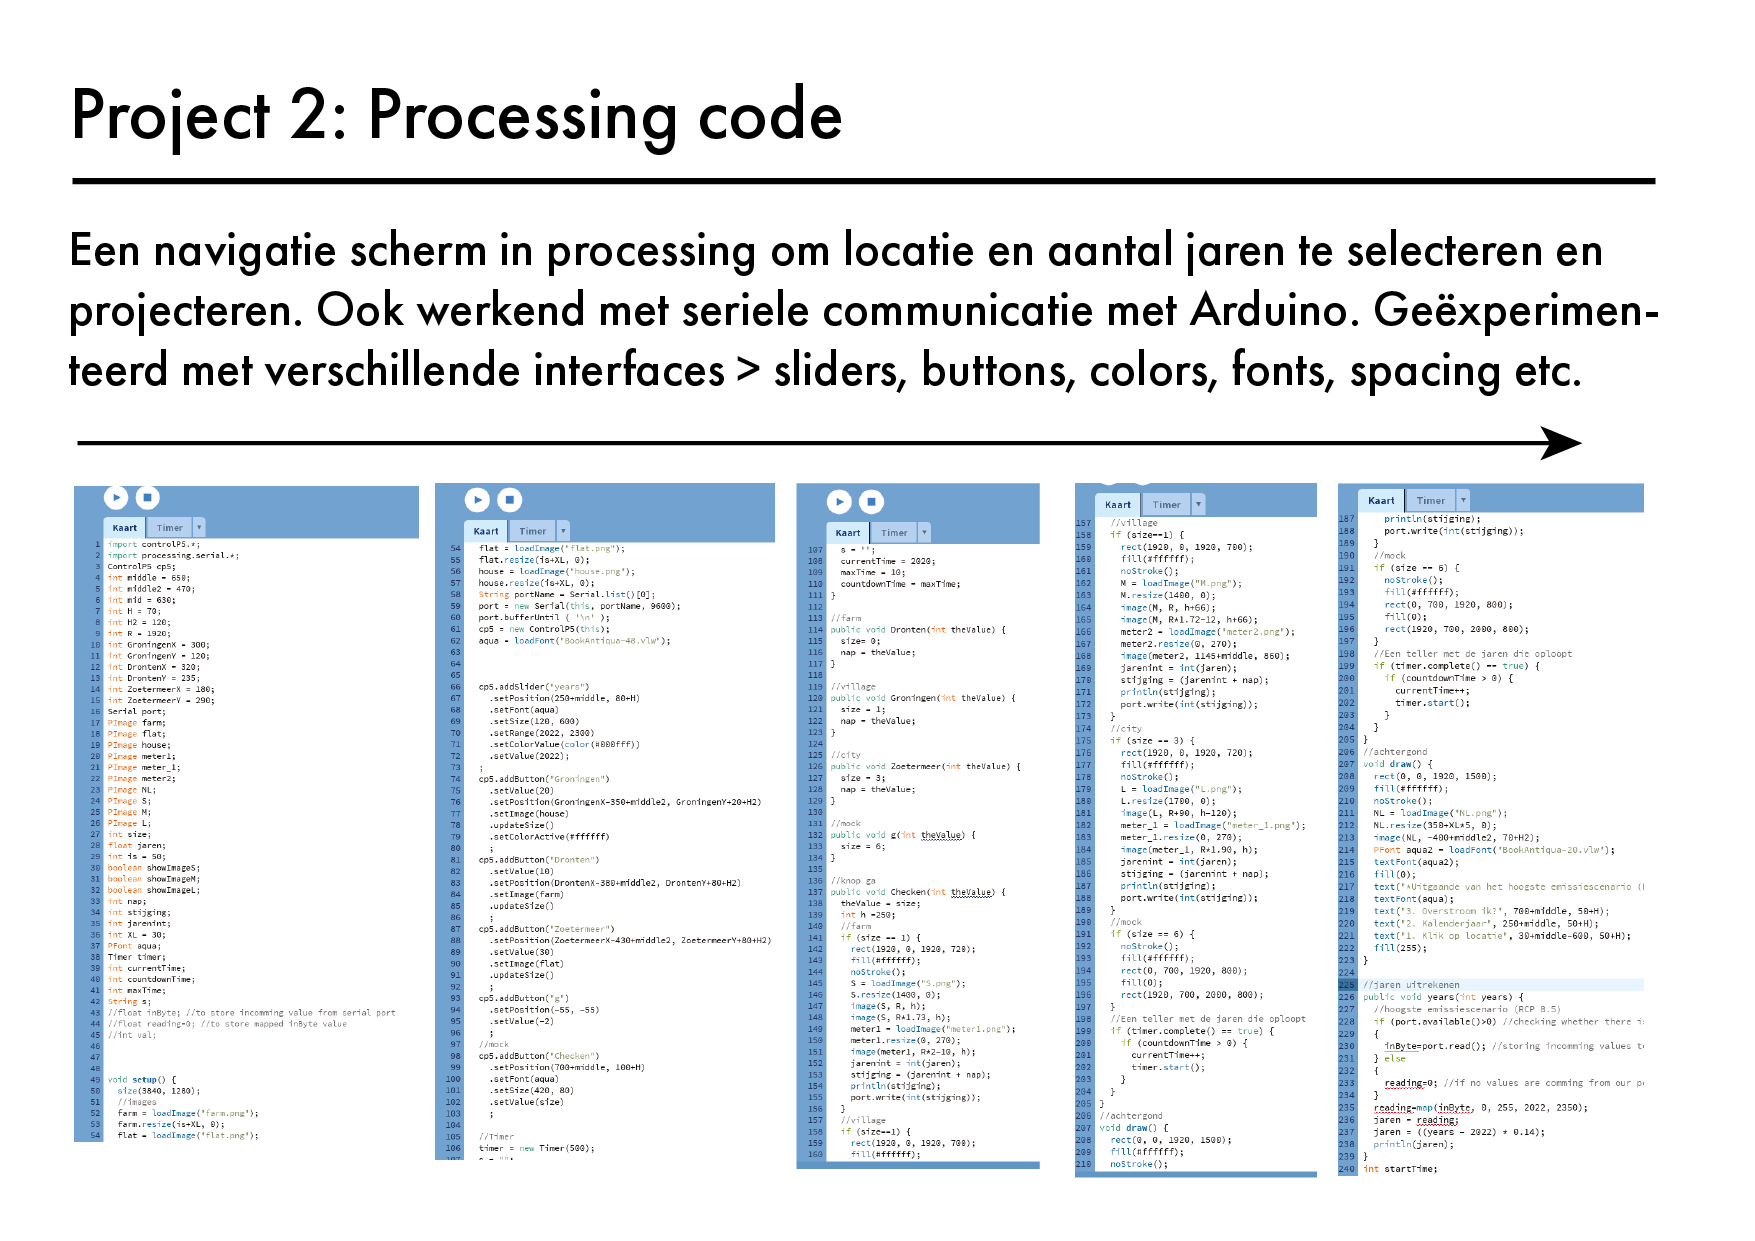
It shows with the data we have now to predict the future and the importance of rising water levels in the Netherlands. The data is based on years of research from local weather stations and put into a data model to predict the future.
Interactive installation
Research/design flyer